That’s hot
Over the past decades, the planet has been experiencing worldwide climate change. In particular, the global warming process is characterized by drastic weather events, such as long periods of drought, or short intense precipitation. These can crucially affect vegetation and animal species on our planet, including human beings.
The impact of global warming is expected to be especially strong in the Mediterranean regions which together with the North Eastern European regions, emerge as the primary hot-spots. Realistic predictions of how the climate will evolve and assessing the relative impact of human behavior upon global warming, is essential for advertising a strategy to avoid and contrast negative impacts.
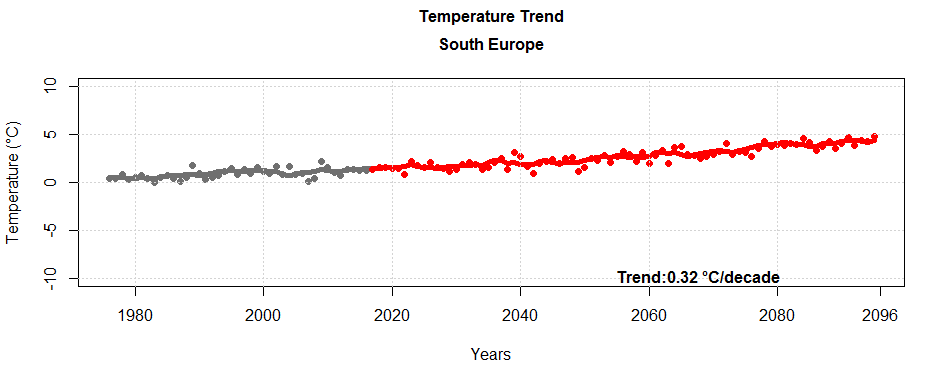
Changes in average temperature over Southern Europe. Gray color refers to the current climate (up to 2017). Dots refer to the average annual temperature values, and the line to the 5-year rolling average. Credit: Sofiadis Ioannis, 2017, Study of Climate Change over Europe for the 21st Century with the use of regional climate simulation driven by the RCP8.5 scenario
The international scientific community thus plays a fundamental role in understanding and predicting the effects of climate change. By means of numerical models, it is possible to simulate processes occurring in climate systems which allows the forecast of their evolution over time. Today, climate models are more complex and computationally expensive than when they first appeared. As a consequence, they are also much more demanding with regards to computing and storage requests.
In my project I am handling output data from the regional climate Weather Research and Forecasting (WRF) model, a numerical weather prediction system for both atmospheric research and operational forecasting needs, which can generate atmospheric simulations using real data (observations, analyses) or idealized conditions. It has been developed by the National Center for Atmospheric Research (NCAR), the National Oceanic, the Air Force Weather Agency (AFWA), the Naval Research Laboratory, the University of Oklahoma, and the Federal Aviation Administration (FAA).
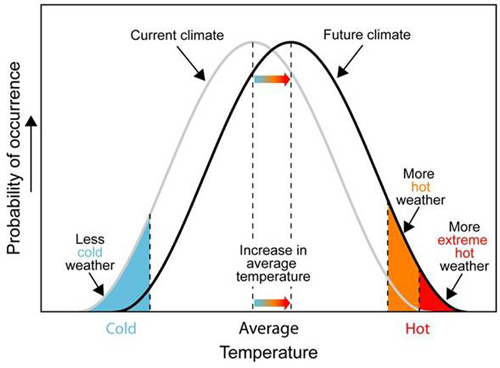
Probability distribution function trend over time.
Credit: Intergovernmental Panel on Climate Change, 2007
The use of visual representations has always been – and is – an integral part of climate science as it helps scientists to better understand complex climate phenomena. Model output of the WRF model are stored in the NetCDF (Network Common Data Form) format, which is very common in the climate community because of its advantages. For instance, it includes information about the data it contains, it can be accessed by computers with different ways of storing integers, characters, and floating-point numbers; a small subset of a large dataset may be accessed efficiently; and data may be appended to a properly structured NetCDF file without copying the dataset or redefining its structure.
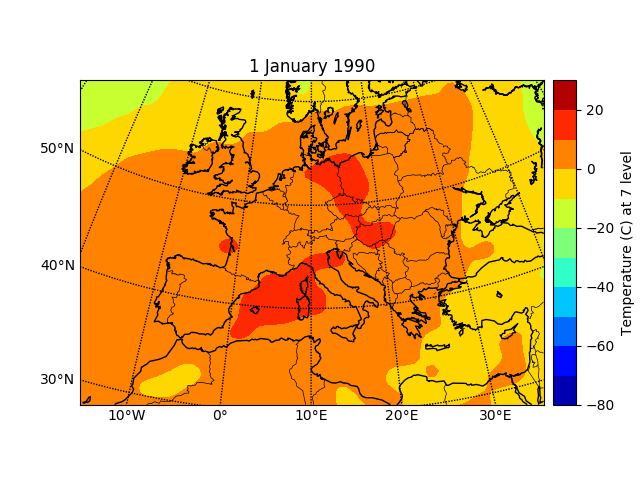
In the past three weeks, I focused on temperature variation, which is the most evident feature of climate change. I wrote some pipelines in order to extract all the information from different NetCDF output data of a “pessimistic” simulation. What does a mental attitude like pessimism have to do with climate models? Well, the most relevant impact on climate evolution is anthropogenic, i.e. impact which is a consequence of human activity. In particular, climate models use a wide range of possible changes in future anthropogenic greenhouse gas emission (the biggest culprit of climate change), and the simulation I am dealing with assumes that greenhouse gas emissions will continue to increase until the end of the 21st century, representing the worst case (hopefully not the real one).
I have produced temperature color maps over Central and Southern Europe for different years, with a final animation of local temperature change over time. It has also been done for different altitudes (see the animation, only for 1990), which carry important information. In fact, global warming often occurs faster at higher altitudes – on mountains, for instance. And what happens on mountains has a deep impact on critical aspects of our economic and social system, such as access to water (re)sources. In fact, warming causes the snow to melt, with a subsequent increasing temperature of the ground. This implies that snow will accrue slowly in the winter, and will melt faster in the spring, with less – and less fresh – water flowing down the mountains during the summer. If more than one billion people don’t have daily access to clean water, climate change will definitely aggravate this situation, with also serious implications for agriculture.
As the professor in the Department of Marine and Coastal Sciences in the School of Environmental and Biological Sciences, Jim Miller, said a couple of years ago: “Water is going to be a major problem over the next few decades anyway and climate change is going to exacerbate it. Who gets the water? Are you going to use the water to grow crops or are you going to use the water to fill swimming pools in LA? Those are ultimately social and political decisions. With climate change, those changes could be more dramatic.”
It’s up to all of us to decide which answer has to be given to Miller’s question.

Leave a Reply