Adding a new dimension to object tracking
If you read my presentation blog post and you have come here expecting to see some nice visualizations about dying blowflies, then keep reading as I have a little surprise for you.
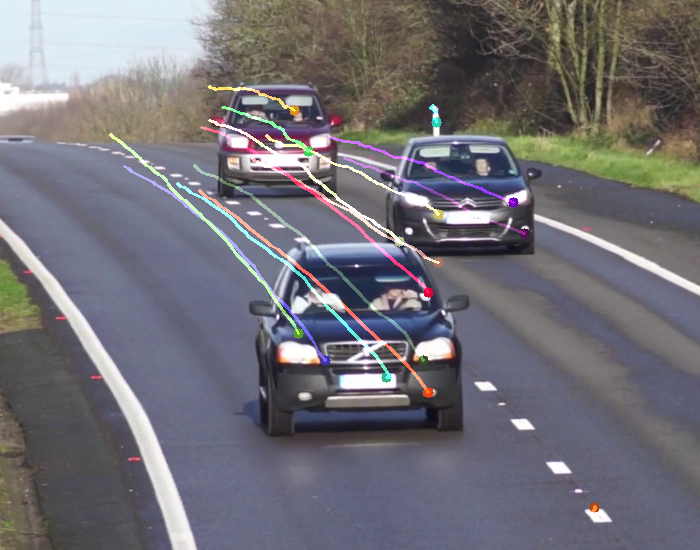
Testing my tracking algorithm first in 2D
As you may already know, my project is about Tracing in 4D data. But what does that really mean? Well, it just means that I have to use math to track the position of an object in a 3D movie! The problem is that this task is very well studied and documented in 2D, but not that much in 3D. If you are interested in Computer vision or Image processing then you may already be familiar with OpenCV, a big and awesome library that comes packaged with every Computer Vision/Image Processing algorithm you may need and hope for, even for tracing objects in 2D videos… but not for tracing in 3D. So I need to make my own algorithm! Fortunately, math comes to help me, because the same algorithms that work in 2D can easily be extended to 3D, you just need to add one more dimension while the math stays the same! Now I just need to implement them in a parallel and high performance fashion!
At this point, you may already have some questions, like: “3D movie? Like Avatar?” Well, not really! 3D films in cinemas are not really 3D but they use stereoscopic photography to give an illusion of depth, while the kind of 3D movies I’m talking about keep the full information about depth representing each 3D volume through voxels (the 3D version of pixels in a 2D image)! That’s why they occupy so much disk space and why they are so computationally intensive to analyze and process! They are often used in the visualization and analysis of medical and scientific data as a result of a volumetric imaging technique (like Computed tomography (CT), Magnetic Resonance Imaging (MRI), or ultrasound). These techniques are now pretty common, for example my dentist asked me to do a 3D CT scan before removing my wisdom teeth!
But the real problem comes in research experiments. Europe has several synchrotron facilities (big X-ray machines) like ESRF, PSI, and MAX-IV. These facilities can produce enormous datasets, especially medical beam lines. They collect 3D volumes very fast to make 3D movies to study what happens over time. These volumes are typically very high resolution ( ~ 2560x2560x2560 voxels) and this means that if, for example, we collect a volume like this 15 times every second for 10 minutes, we get 9’000 volumes with a total size of more than 300 TB! That’s like 10’000 blu-ray discs!
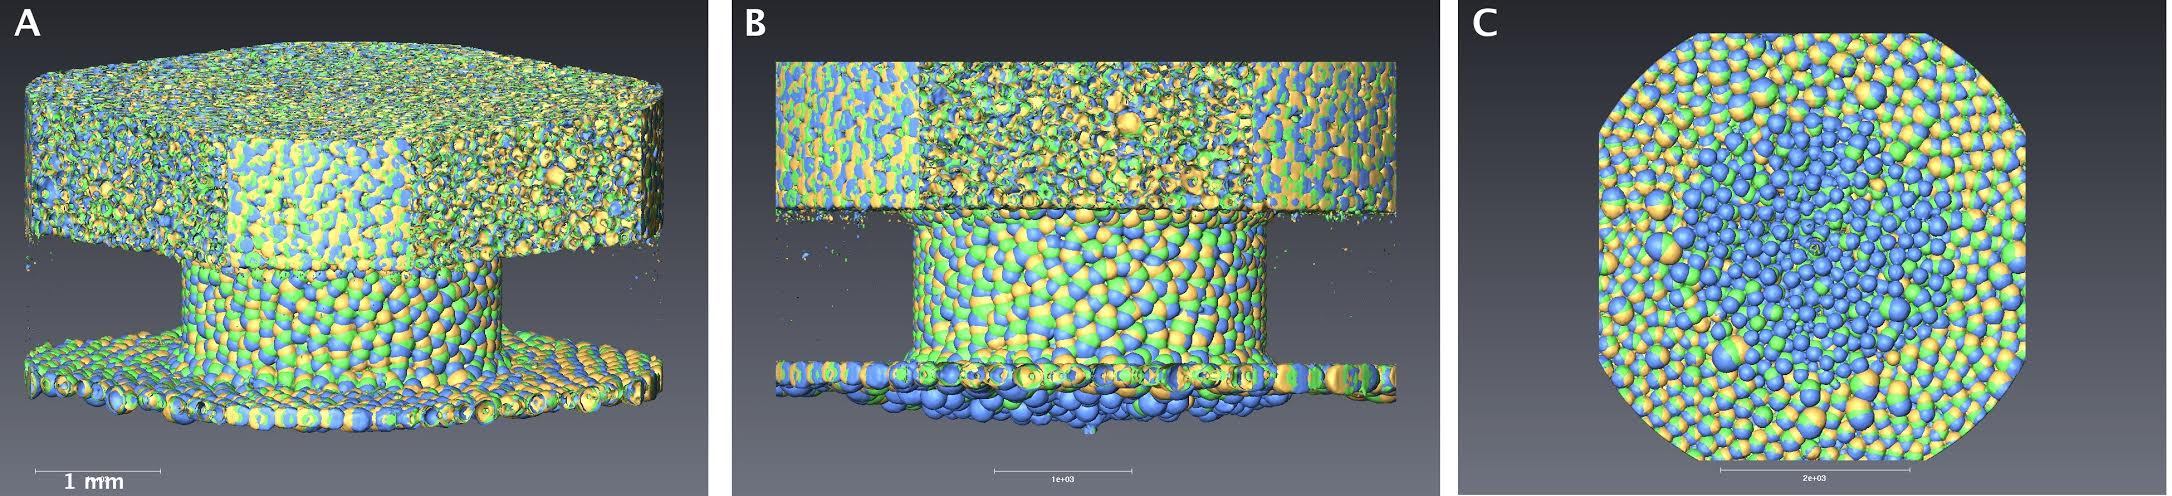
Tomographic reconstruction of a system that is a constriction through which a liquid foam is flowing.
The analysis of this data typically involves tracing one or more objects, such as a heart clap or lung tissue, in 3D over time. Another example is the paper by Rajmund Mokso on which my project was born. Yes! It’s the one about the blowflies! He and some other guys developed a very fast and high resolution CT imaging technique to study their flight muscles, which swing back and forth 150 times per second! As promised, here you can find a visualization (that came attached to the paper) of the kind of data they collected. But the cool thing about the algorithm is that it doesn’t depend on the data and it could work on any dataset! Just this week I was handed a dataset where the system is a constriction through which a liquid foam is flowing.
So I need to get back to work and I will let you know how it goes in my next blog post!

Leave a Reply