Climbing higher everyday
During this summer I’m trying to get a little better every day. As a hiking enthusiast, I really love to get on track during weekends. Scottish Highlands paths seem to be slightly worse maintained and much less congested than Tatra Mountains paths. It is great for someone who likes to get off the beaten track sometimes.
Land of Highlanders
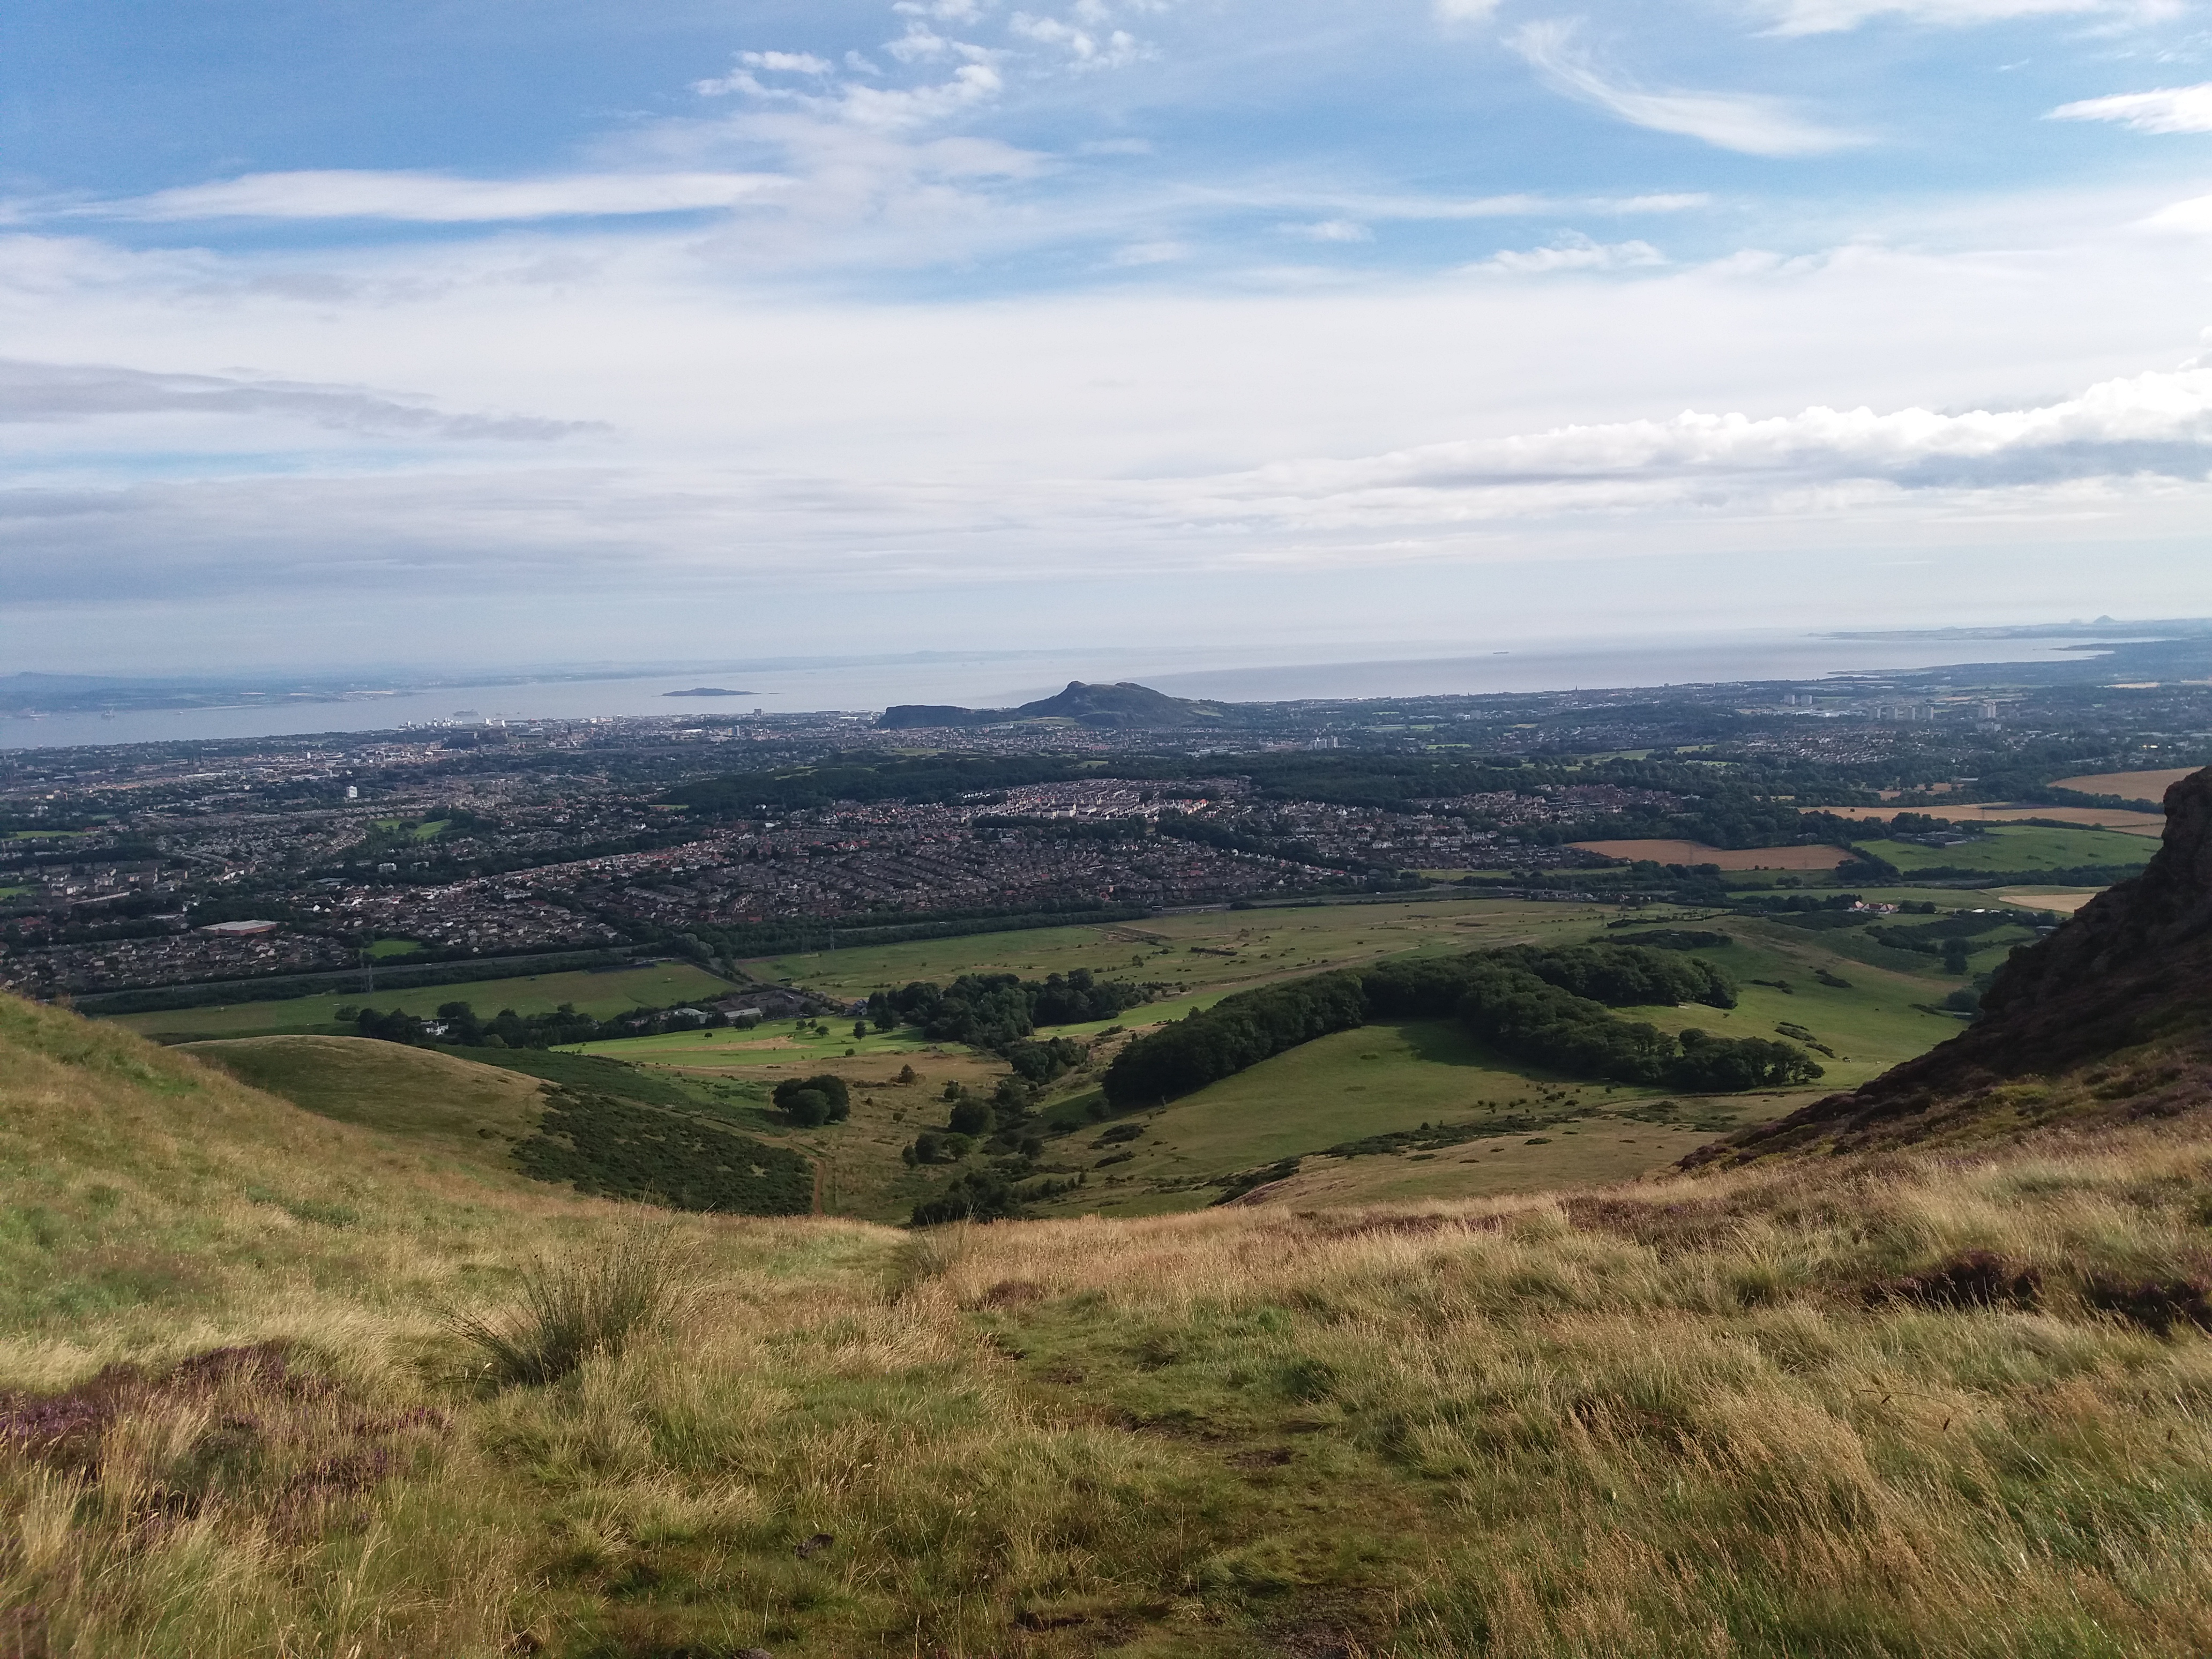
View of Edinburgh from the Caerketton Hill
Last two weekends I walked almost 100km by foot. The tracks and peaks of Pentland Hills Regional Park, the nearby town, villages and various types of chapels had become my goal. Even 12 rainy days in a row could not stop me from seeing the moorlands. My feet have hurt afterwards but it was really worth it – the views were breathtaking.
I’ve also visited the National Museum of Scotland in Edinburgh. I would be lying if I said that I had been expecting it to be that large! The museum has 8 floors and a roof terrace. There was a huge number of exhibitions, half of them about Scottish history and achievements.
Let’s get back to business
Hiking wasn’t the only thing I did here in Edinburgh. I’ve been progressing with my project too. However, since my last post, some news emerged:
- It will be hard to set up any new web services designed by me on the EPCC servers
- My goal has changed to prepare the best front-end visualisation possible
- This way if EPCC authorities like my front-end work, maybe they will pursue on setting up back-end services for it.
The best examples of data visualisation I’ve ever seen.
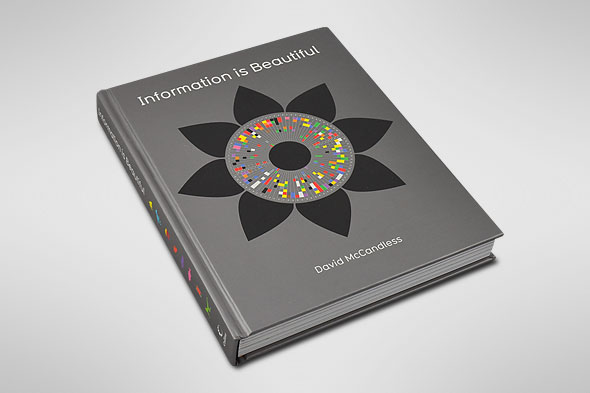
Andy, my mentor, has given me an inspirational book – “Information is Beautiful” by David McCandless. It’s easy to read and funny – an exceptional example of a data visualisation masterpiece. After finishing it by myself I can suggest it as a great idea for a gift for anyone, even someone not interested in data visualisation.
I’ve started learning and working with Angular. In my previous post, I’ve explained what it is. Now I feel obligated to talk a bit about my work with this framework. Its architecture is similar to an architecture of many other MVC (model-view-controller) or MVVM (model-view-view model) engines. Under the hood, Angular uses modern web browser capabilities to render highly optimized code that is previously compiled from TypeScript and template syntax. It introduces modularity, routing, testing, animations, accessibility and much more features that are desirable for fast and easy to develop Single Page Applications.
One of the most promising features seems to be its modularity. Each app consists of modules which combine components, directives and services. Templates are written in special Angular syntax and component’s code is written in TypeScript. The view is combined with the controller through one-way binding: either property or event binding.
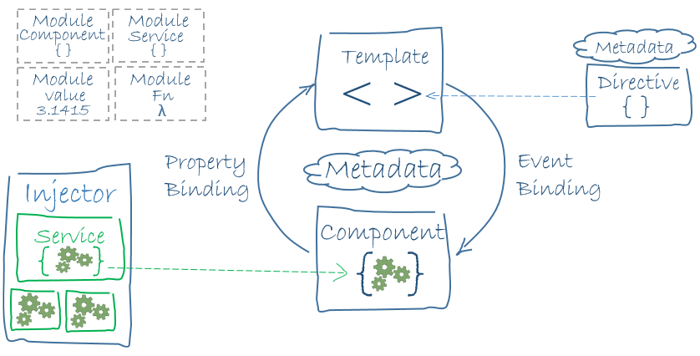
Overview of Angular architecture.
Last time I’ve also mentioned something about D3.js. It’s the JavaScript library for HTML canvas and SVG manipulation. I’ve decided to use the Angular module called ngx-charts which combine Angular and D3 power. This module provides me with many customizable charts out of the box. It also allows for constructing custom charts by leveraging the various components that it exposes. It will be very useful to realize the data visualisation ideas that have arisen in my head since the beginning of the holidays and were even more boosted by the previously mentioned book.

Leave a Reply