Combining Big-data, AI and 3D visualization for datacentre optimization
Project reference: 2112
Datacentre in production are characterized by the combination of extreme parallelism and performance demand. This translates in large number of resources to be management constantly stressed by intense computational patterns.
Each of the HW and SW resources reports metrics underlying its status and usage. This accounts for terabytes of data produced daily which can be leveraged for automating the management of the entire datacentre. Big-data, artificial intelligence and visualization technologies can be applied to deploy datacentre automation solutions.
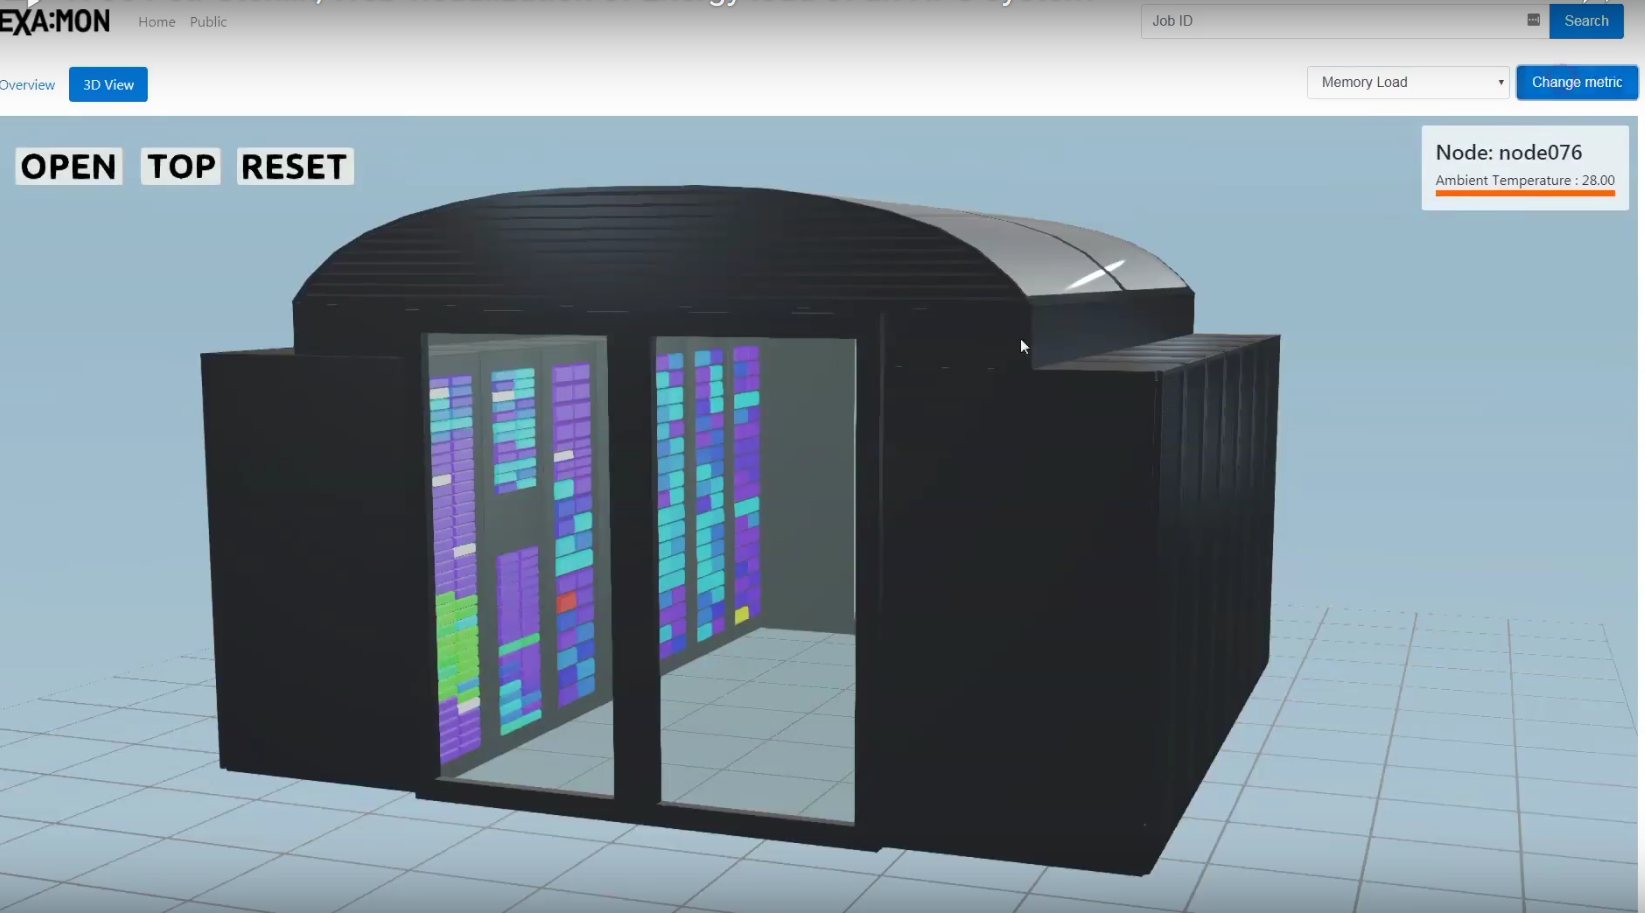
With this prospect CINECA and UNIBO have since years been pioneering in deploying such solutions to the CINECA datacentre. The goal of this project is to extend the current solution with 3D visualization and predictive models to develop a full digital twin of the datacentre.
In the framework of SoHPC program, we aim to integrate a 3D visualization of the datacentre with the live data collection as well as with forecasting of future critical behaviours. Student will gain knowledge about data collection, ML analytics and data visualization.
Project Mentor: Andrea Bartolini
Project Co-mentor: Martin Molan
Site Co-ordinator: Massimiliano Guarrasi
Participants: David Mulero Pérez, Sepideh Shamsizadeh
Learning Outcomes:
Increase student’s skills about:
- Big Data Analysis
- Data visualization
- Python
- Open Stack VM
- Blender
- HPC environments
- Deep learning (depending on the difficulty)
- TensorFlow (depending on the difficulty)
HPC infrastructures
Student Prerequisites (compulsory):
Python
Student Prerequisites (desirable):
- At least a basic knowledge of at least one of the following tools: TensorFlow, Pytorch, Keras (TensorFlow/Keras preferred)
- Pandas
- Spark
- Blender
- 3D modelling
Training Materials:
None
Workplan:
Week 1: Common Training session
Week 2: Introduction to CINECA systems, small tutorials on big data, data collection systems and 3D visualization system and detailed work planning. Depending on the difficulty (and the interests of the student) introduction to ML data analytics solutions.
Week 3: Problem analysis and deliver final Workplan at the end of week.
Week 4, 5: Production phase:
Increased difficulty:
- Benchmarking of existing ML data analytics solutions
- Implementation of outputs from best performing ML solutions into 3D visualization software
Baseline project:
- Importing data from data collection framework into 3D visualization solution
Week 6, 7: Final stage of production phase. Implementing feedback form domain experts and end users (CINECA staff).
Week 8: Finishing the final movie. Write the final Report.
Final Product Description:
The creation of a digital twin of the datacentre.
Adapting the Project: Increasing the Difficulty:
Different ML solutions for operational data analytics (anomaly detection, downtime prediction) will be benchmarked and evaluated. The best performing solutions will be included in the final visualization.
Adapting the Project: Decreasing the Difficulty:
Basic parameters from the system will be integrated in the existing visualization software.
Resources:
The student will have access to our facility, our HPC systems and databases containing all the measurements, system logs and node status information. They could also manage a dedicated virtual machine.
Organisation:
CINECA – Consorzio Interuniversitario
![]()

Leave a Reply