How to Analyze a Genome

Hello, and welcome back to my blog! Since I published my first blog post, where I introduced this project, I have been learning about genomics and how to analyze DNA on a High Performance Computing cluster. My work has revolved around JLOH, a toolkit for analyzing genetic data. In this blog post, I will go deeper into how this works and tell you more about JLOH.
A DNA strand is a double-stranded sequence of the molecules: Adenine (A), Thymine (T), Guanine (G), and Cytosine(C), which are paired in a double helix as AT and GC and are collectively called nucleotides. Just like the order of letters in a word determines its meaning, the order of these bases encodes instructions for the cell machinery to build proteins, and is what we call a “gene”. Genes make up a chromosome, and several chromosomes constitute a genome.
Working with DNA is complicated because DNA sequences tend to be long. For context, every single cell in the human body contains a complete copy of the human genome, whose haploid size is approximately 3 billion base pairs (Gbp). Humans are diploid, so the actual DNA content is double (6 Gbp). To handle this complexity, scientists have come up with different file formats for representing the correspondingly large genomic data so that it can be analyzed in an HPC environment.
File Formats
To analyze a genome, we must first establish its exact genome sequence through DNA sequencing. For this project, we are working with hybrid yeasts, sequenced using Illumina paired-end sequencing. This technology produces a pair of sequences for each DNA fragment called “reads”, which come as a pair of files in FASTQ format with each file containing millions of reads. FASTQ is a text-based format containing the information related to each sequencing read organized in four lines: 1) an identifier, 2) the actual sequence, 3) a separator “+” sign, and 4) an ASCII encoded quality score for each sequenced nucleotide.
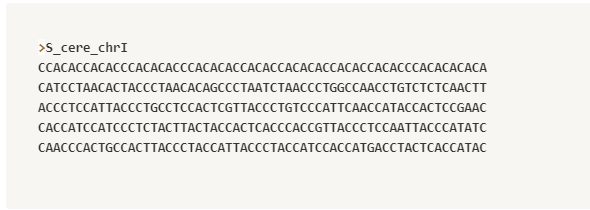
FASTQ is ideal for representing short sequences and their quality scores. A leaner and simpler method to represent longer DNA sequences without any cumbersome quality score is the FASTA format. This format contains only the sequence name and the sequence itself. Just like FASTQ, FASTA is a text-based format that uses single letter codes: A, C, T, and G to represent the bases in a DNA sequence. Before high-throughput sequencing technologies such as Illumina, this was the only way to represent a sequence, as traditional sequencing methods e.g. Sanger sequencing could not produce the base quality. Now it is mostly used to represent reference sequences.
The next step is establishing the location of the sequencing reads within the genome. To do this, the raw reads are aligned onto a reference sequence. This generates a tab-delimited text file called a Sequence Alignment Map (SAM). SAM files tend to be enormous so they occupy a lot of disk space and may take a long time to process. For easier analysis, SAM files are converted to a compressed binary format called BAM (Binary Alignment Map), which despite not being human-readable is smaller in size and easier to access using a computer.

Often when studying the genetics of a population, most positions in the genomes of the individuals under study will contain the same base. Such fixed sites are not very informative and can be dropped from the analysis. Instead, we keep track of how many differences exist between the reads and the genome (i.e. “variants”), and where they occur within our reference genome. This is done using another tab-delimited text format known as the Variant Call Format (VCF), generated from mapping the reads to a reference sequence and identifying the variants.

Now that the data is in text format, it can be parsed and manipulated using a scripting language such as Python.
Enter JLOH…
JLOH from the block
Developed at my host lab, JLOH identifies regions in a genome where stretches of the differences between two genomes have been lost during evolution through a process called “loss of heterozygosity”.
The sample we are using for testing is a hybrid of the yeast species Saccharomyces cerevisiae and Saccharomyces uvarum. When used with a hybrid, the JLOH algorithm needs three inputs:
- Two reference sequences in FASTA format, containing the genomes of the parents of the hybrid species.
- Two BAM files with the mapping records of the hybrid genome reads onto the two parental genomes
- Two VCF files containing the SNPs or single base pair substitutions, representing the differences between the sequenced reads of the hybrid and the two parental genomes.
With these files, JLOH outputs blocks of the two parental genomes where some alleles have been lost, i.e. LOH blocks.
JLOH outputs several files, the most important one being a TSV file containing the LOH blocks, aptly named jloh.LOH_blocks.tsv. These output files together with the input BAM files can be viewed in a genomic viewer and would look something like the image below and the results interpreted.

That is it for this post. It is a long read so if you have read it all through, you deserve a pat on the back. I hope you now have a basic understanding of how a genome can be analyzed so stay tuned for the next post where I will tell you a little more about JLOH’s core functionality and what I have been doing to make sure it is fast, resource-efficient, and can scale on an HPC cluster. In case anything is unclear, please leave your question in the comment section below and we can discuss it.

I really enjoyed reading this. It was easy to understand genome analysis from the way you have outlined your project topic. Good job Victor. Looking forward to your next blog post!
Thank you for the feedback and continued support Regina. I appreciate it!
Keep on keeping on Victor.
Thanks Mum! 🙂
Amazing work Victor👏🏿
Thank you for reading June!
I’m really proud of you. Keep on keeping on.
Thank you for reading the article!
Nice read! I love the organization here and the flow of thought. It makes it easy to understand. Great job. Keep it up.
Thanks for reading, Damola. I am glad you enjoyed it!