I can not simulate a farewell

Unfortunately this moment had to come, and to be honest I barely felt the flow of the time during these 2 months here at Luxembourg, was a really ephemeral summer. But let’s go straight to the good news and present my collaboration for XDEM developer team.
I am very thankful to present my contribution which will be part of XDEM Continuous Integration which is important to
ensure and maintain the performance of the software with new versions of the code, we automate the process of per-
formance analysis and regression detection. In this way developers could check if the changes affect the performance of the simulation, and highlight the part of the computation which is impacted.
The data acquired to test the performance report is from a blast furnace charging simulation, this involves intricate physical phenomena that must be modeled (and validated) carefully and require the use of High-Performance Computing (HPC) platforms which in this case is Aion cluster at ULux. For those curious there is a video with a graphical representation of the simulation.
This report points to answer the following questions:
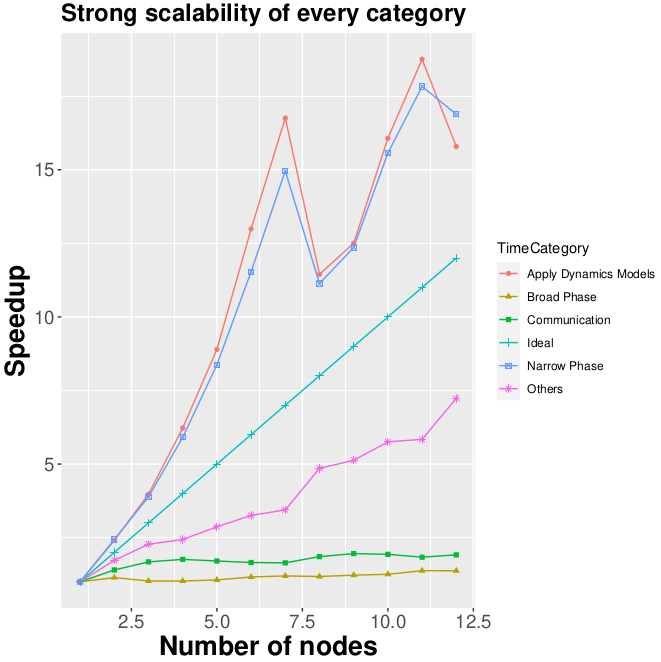
- Strong Scalability: If I have two processors instead of one, will I get done the job in half the time?
- Weak Scalability: Will two processors finish twice the job as in done with only one processor?
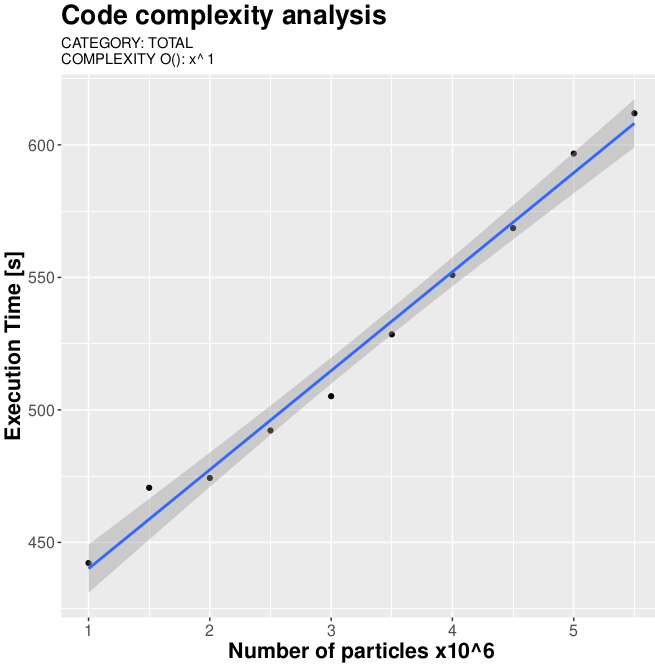
- Complexity characterization: How the computation time increases according to the size of the problem?
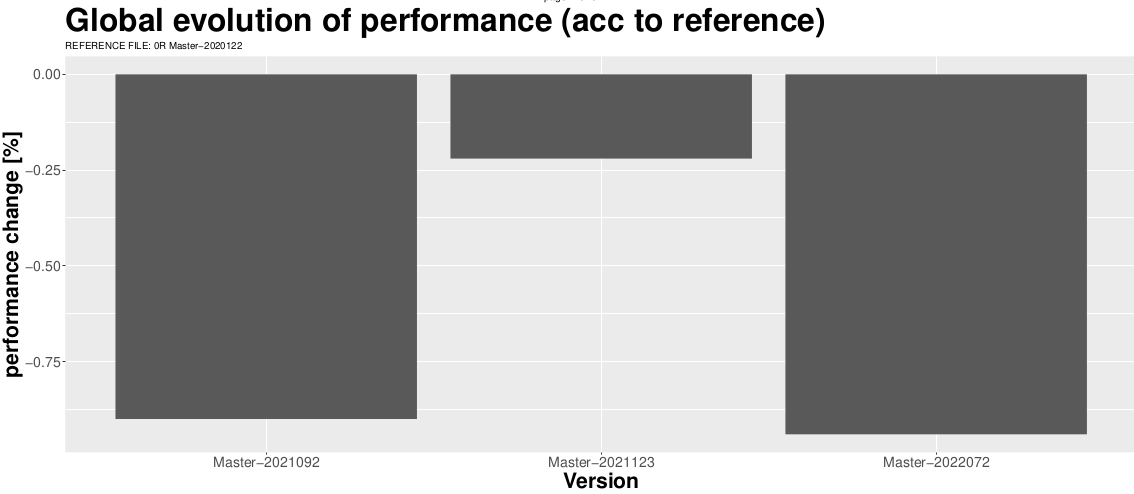
- Performance regression: Are there crucial changes between different version of XDEM?
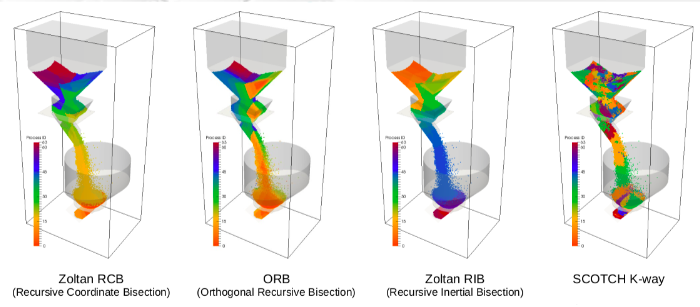
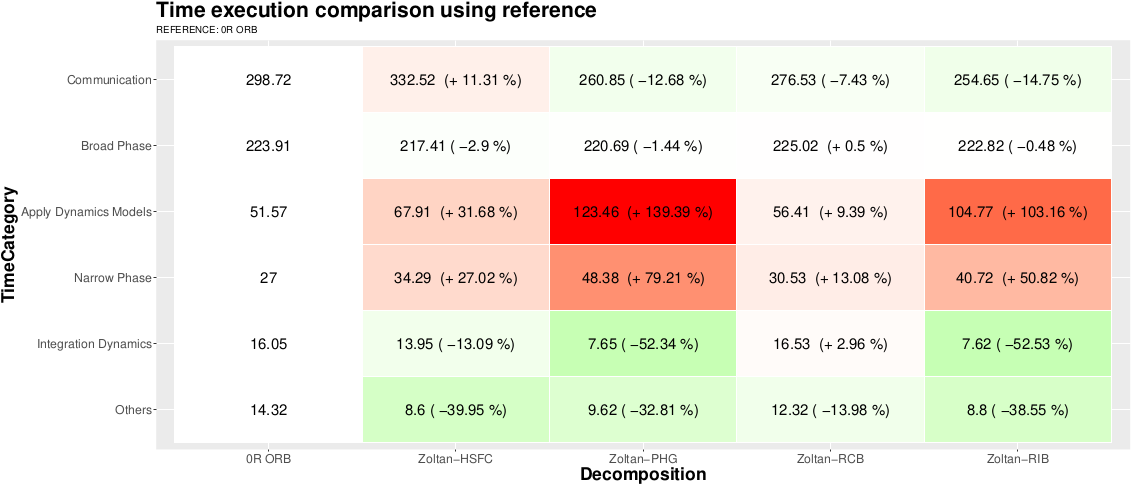
- Decomposition comparison: How the execution performance differs with different workload distribution methods?
- Workload balance: Does every node do the same amount of work?
Let’s explain a little bit the strong scalability results, sit hows the time execution evolution according to the number of compute nodes, as well as the speedup plot. The R script loads and transform the data generated by XDEM and once obtains the time execution for the different phases, it creates a speedup plot for each category and focusing on the most relevant (the costliest categories). A heatmap of the efficiency accross different categories is included as well as a steamgraph of the proportion of execution time to observe the evolution and change in importance of the differente categories when more compute nodes are added.
Another example, the complexity characterization identifies the complexity of the measured computing time for the principal categories as well as evolution graph of the time execution for the categories.
Besides it creates a heatmap for the scaling factor, checking as reference a linear increase, if it is scaling in a higher order it reveals a deficiency on the category.
Sadly it is time to say bye, but hey now XDEM has an additional tool that will help this software to keep track of the improvement over time, developers could attach it to XDEM continuous integration and even users could test with a little version of the original work to see which is the best decomposition or version for their project.
It has been a pleasure to be here with you kind readers and once again thanks to PRACE for this amazing opportunity :D.

Leave a Reply