Job Queue Visualization: not as easy as creating Excel graphs :(

Architecture Overview
The above Prometheus architecture diagram gives a very good overview of what our Time Series Monitoring system looks like. The architecture is divided in three main components.
- The Prometheus Target is a http endpoint where a script is being executed which creates metrics from information produced by a job or service running and makes these metrics available over the above http endpoint.
- The Prometheus Server makes a pull request (scrapes) from the Prometheus Target http endpoint for these metrics created by the executing script. The metrics scraped are stored as Prometheus’ own flexible query language called PromQL.
- Data Visualization of these metrics is created by executing a pull request of metrics stored as PromQL from the Prometheus Server. The resulting PromQL can be parsed and refined by the end user and displayed on graphs.
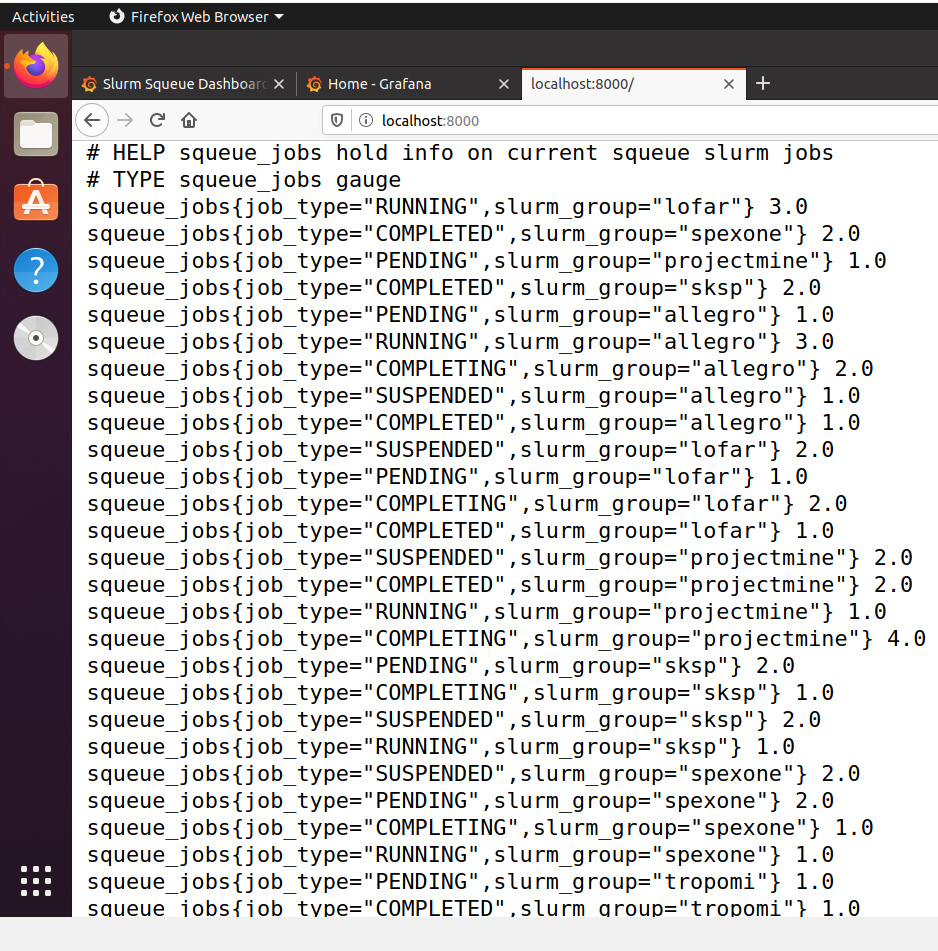
Job Queue Exporter
The Job Queue Exporter acts as the Prometheus Target. Information we are interested in is job queues of HPC schedulers. Two main schedulers exist for HPC systems: Slurm & TORQUE. Because Slurm is the most well known and used scheduler, the rest of the post will focus on the Slurm squeue command which returns information on job queues for the Slurm scheduler.
The exporter is a Python3 script running which executes the squeue command, retrieves information on job queues running, converts the information into a Prometheus Gauge Metric and makes the metric available over http://localhost:3000.
The exporter has been created as a Python pip package and can be installed through pip3 install job-queue-exporter or the source code is found here. Unit testing of the exporter used pytest and tox testing tools.
Prometheus Server
Fortunately, the Prometheus Server takes care of all the scraping of the exporter http endpoint, processing of metrics and storing of information in PromQL which leaves very little to worry about for the developer.
The number one file in configuring Prometheus is prometheus.yml which specifies all the Prometheus Targets, their associated http endpoint where metrics are exposed and scraping time interval. The prometheus.yml file configured for our system can be found here and the result can be found at http://localhost:9090/ where Prometheus is running by default.
Other information can be configured in the prometheus.yml associated with Prometheus Rules and the built-in Prometheus AlertManager system . One rule configured for our system is when a Prometheus Target experiences downtime, the system maintainer can automatically be notified over email or Slack and can take the correct measures to revive the failed node.

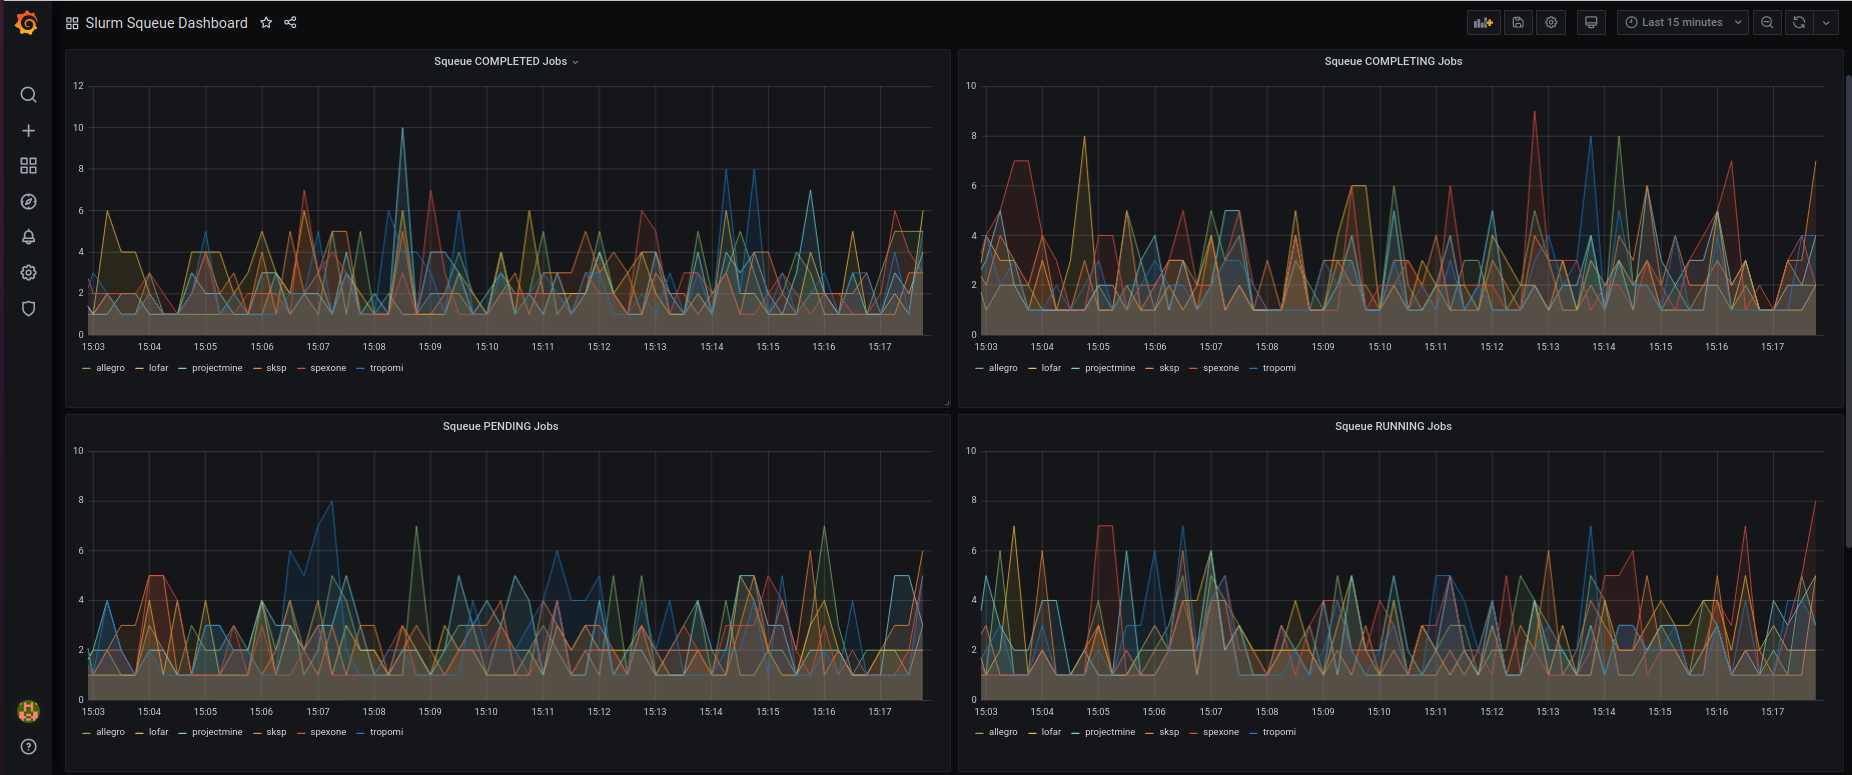
Grafana Data Visualisation
The Prometheus Web UI can be used to visualize Prometheus PromQL queries. However, Grafana is a more elegant and stylish data visualization software that is compatible with Prometheus. Two tasks need to be completed before getting nice dynamic graphs of job queue information.
- Configure the Grafana Data Source to pull from the above Prometheus instance running at
http://localhost:19090/prometheus/ - Configure the dashboard which is stored as JSON data.
Our graphs are created through Prometheus PromQL queries in the following format: squeue_jobs{job_type=<job_type.name>} which creates graphs for individual job queue types. The graphs can be further inspected by clicking on an individual {{slurm_group}} in the graph legend.
The guys & gals at SURFsara can now view job information in visually appealing graphs. Next steps involve collecting data from the graphs to determine if any time series trends or statistical properties occur when jobs are run on SURFsara HPC machines.
Full System Deployment
Ansible is the open-source software provisioning, configuration management, and application-deployment tool enabling infrastructure as code that fully automates deployment of the above system with the click of a button.
In addition to running the above tasks, the Ansible playbook configures Prometheus and Grafana to run behind a reverse proxy. Often, machines have a limitation, due to firewall policies or other security reasons, only opening to the external world ports such as 80. If you take a closer look at the above Prometheus Targets running on the server, it is evident that Prometheus is actually running over port 19090 instead of 9090 and Grafana over port 80 instead of 3000.
If interested, full deployment details of the system can be found over at the following repository.
Thank you for reading, Cathal.

Leave a Reply