Results and Concluding Remarks

Hello all! In my previous blog post, I described the procedure we follow to calculate the thermal conductivity of damaged Tungsten. This will be my final blog post, and I will share my results.
I investigated the thermal conductivity of Tungsten at 600K for several different damage levels. As prescribed in my previous blog post, each system was subject to CRA, NPT, NVT, and NVE processes. You can see the damaged part in the figure above. The red and blue atoms are interstitials and vacancies, respectively. The temperature changes of the system in NPT, NVT, and NVE are plotted with respect to molecular dynamics steps in the below:
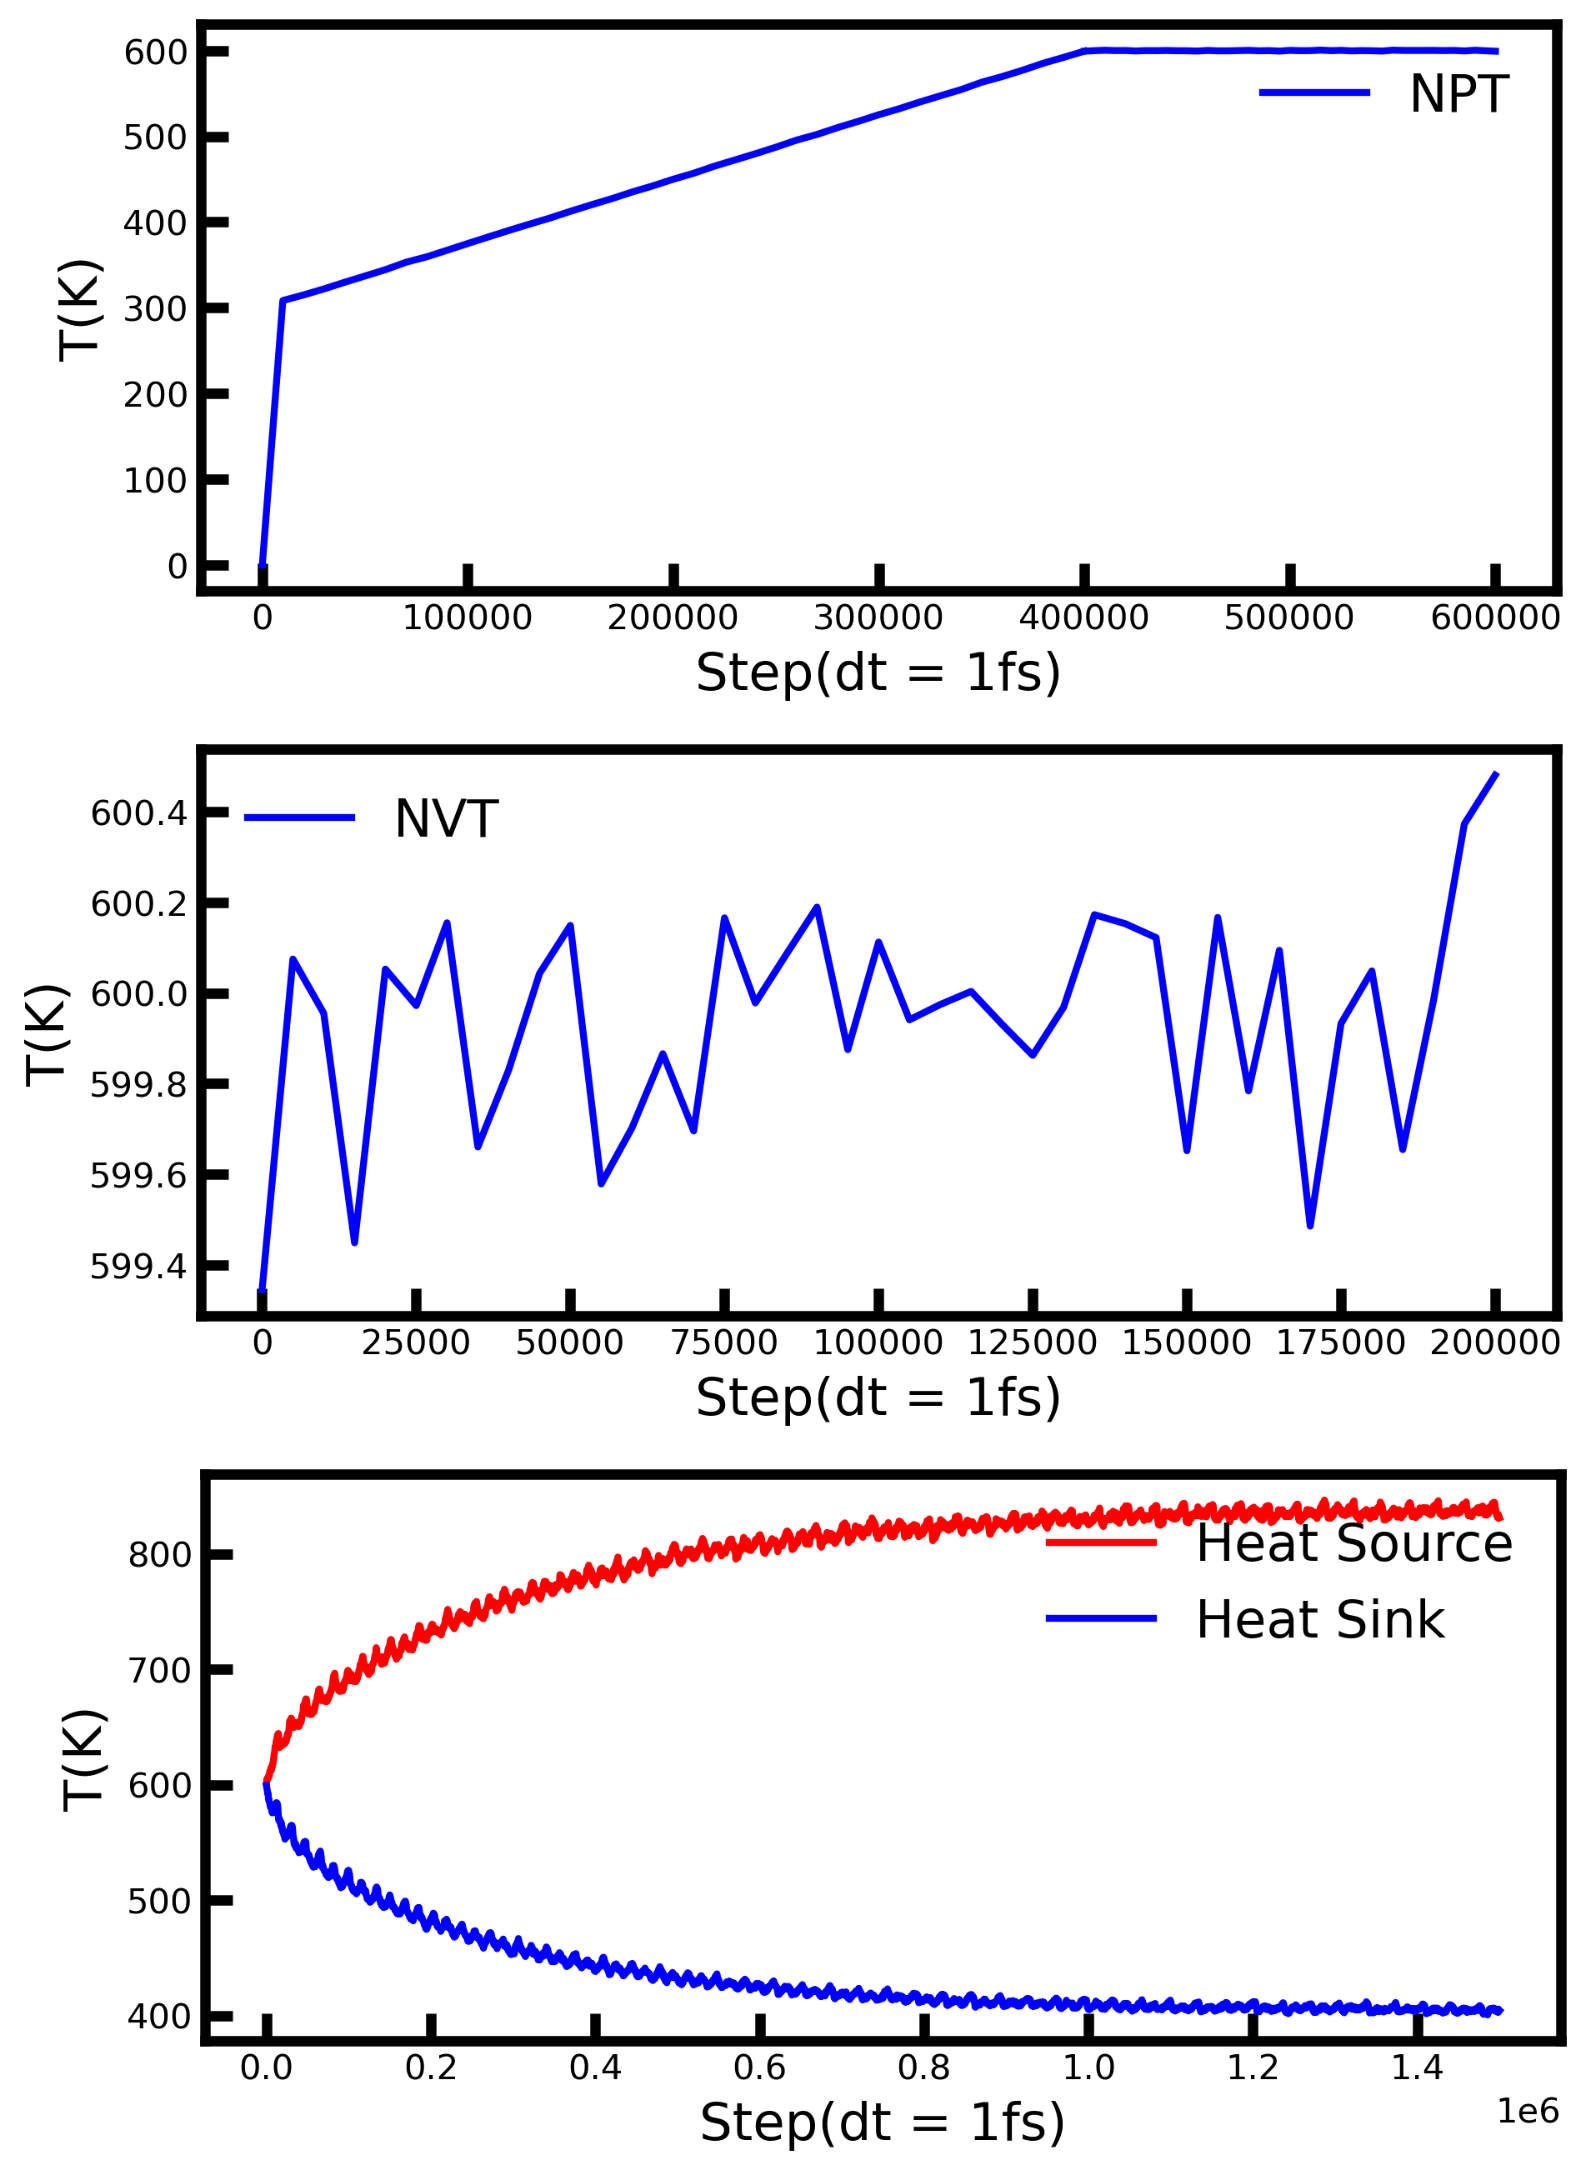
As you can see from the last plot, the steady-state temperature gradient is established, and the temperature is nicely converged. Afterward, the temperature profile of the system is calculated and plotted as follows.

The same procedure is applied to other damage levels, and the resulting thermal conductivity is plotted with respect to the number of defects after recombination.
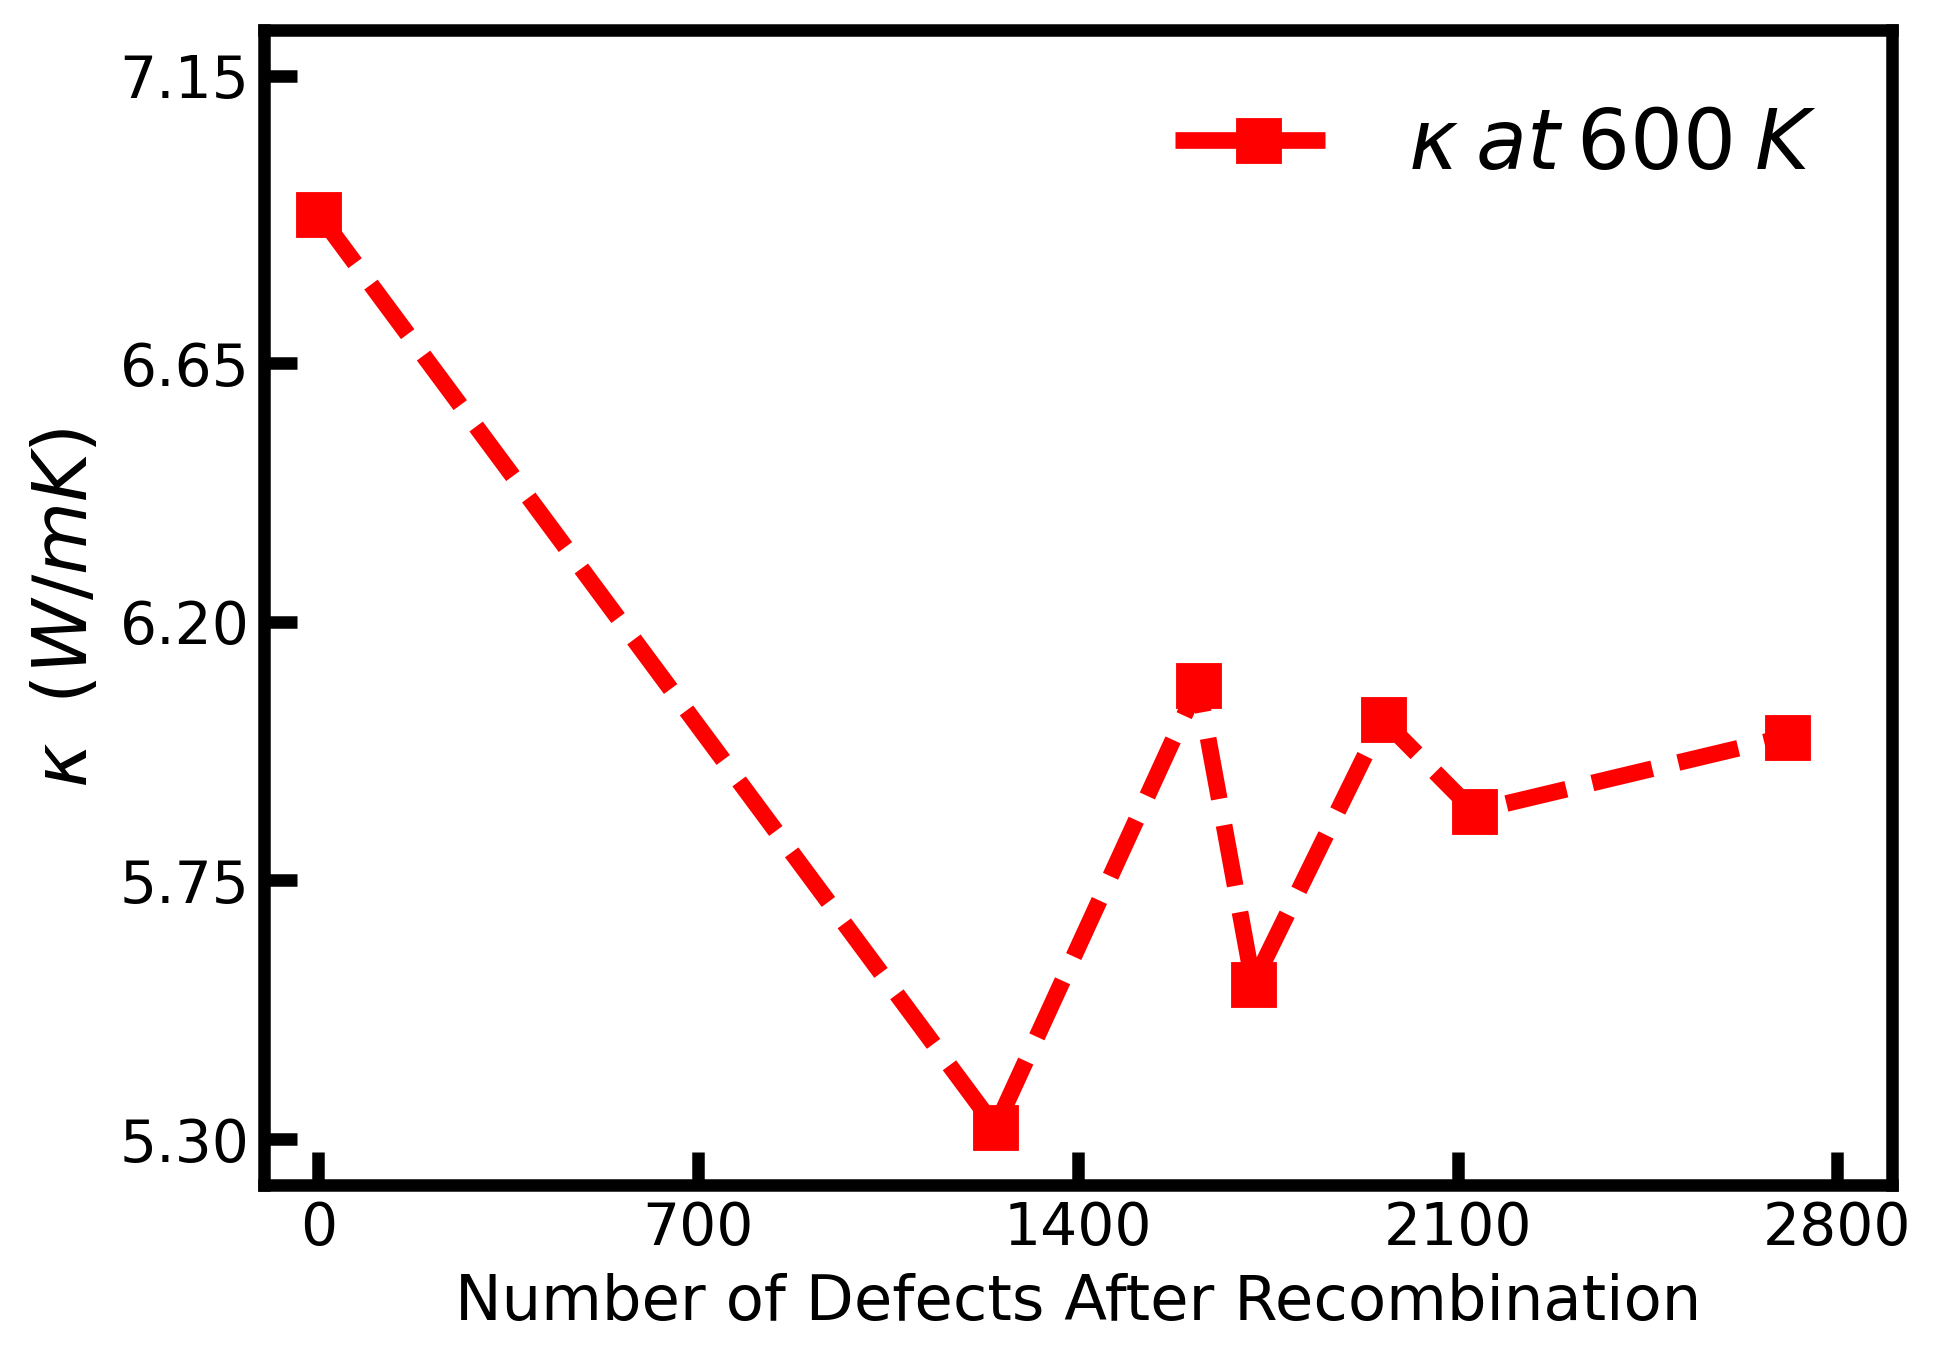
Although we can see that the thermal conductivity of the perfect system(no damage) is higher than the damaged systems, it is not clear to conclude a definite trend using the number of defects after recombination. Moreover, different defect types can form in the damaged part, which might differ in potential energy and geometry. This may lead to a difference in thermal conductivity for different damage levels. Therefore, the investigation can be broadened for other descriptors.

Leave a Reply