Visualization of Olfactory Bulb Neural Network

Hi everyone,
In this post, I would like to share what I have done so far and what the next steps are in my project with you.
I am responsible for the visualization of olfactory bulb data. Olfactory bulb is a part of the olfactory system and is located on both sides of the brain. It takes odor input coming from odor receptors, processes and sends it the rest of central nervous system of the brain via the olfactory tract. Olfactory bulb consists of many types of main neurons and inter-neurons, that makes its structure complex. One of the neuron type located in olfactory bulb are mitral cells.
Mitral cells have a key importance for the olfactory bulb. They are responsible for transmitting olfactory information into the other parts of the brain. A mitral cell neuron consists of tufts, apic, soma and lateral dendrites. Tufts are a part of a mitral cell that takes the electric pulse from other neurons. A mitral cell has more than one tuft. The input coming from other neurons is transmitted to apic through tufts. The Apic is a single cylindirical structure that connects tufts to the neuron cell body. It gets the electric pulse from tufts and transmits it to the cell body, which is called soma. Soma is the center of a mitral cell. It transmits the electric pulse to dendrites. Dendrites are structures that enables a mitral to transmit the information to granule cells.
Granule cells are another type of neuron cells located in the olfactory bulb. A granule cell has a simpler structure than a mitral cell. They are a smaller size but there are more of them than the mitral cells. The connection between mitral cells and granule cells creates the whole structure which is called as a neural network. Mitral cells and granule cells together create a sphere form. While mitral cells fill up the surface, granules fill up the inside of the sphere structure. It is believed that the output of a mitral cell is not a passive reflection of their input coming from the olfactory receptor neurons and external tufted cells. The exact type of processing in odor discrimination that mitral cells perform is still a matter of controversy.
My project emerges for this reason. It is believed that each type of odor input creates a different pattern in the structure including mitral cells and granule cells. So, if we visualize the whole structure, it is easier to find the patterns and classify them to understand which odor input is currently processing. In short, the visualization aims to make odor discrimination in the neural network easier. It may also help the researchers in understanding what the importance and the relationship of the mitral and granule cells are with the other parts of olfactory system.
The design of the neural network is made by a neural network simulator called NEURON. The software provides us data files including the topology of mitral cells and granules as well as their timing values. We have 3D points in Cartesian coordinate system and radius data for tufts, apics, somas, dendrites and granules. The data of a granule cell is in the format (x, y, z, radius). It is in the shape of a sphere. Apic, tufts, soma, dendrites aren’t in a single structure. They are consisting of substructures which we call as segments. A segment data of each part describes with two (x, y, z, radius) data. The simulation time which is also given by NEURON software is approximately between 56 msecs and 36000 msecs. Timing values represent in which time during the simulation these parts have the electric pulse.
We used Blender 2.75 software as a 3D visualization and animation program. It is open-source and has many features including video editing. With this work, we have proved the ability of Blender in making a scientific visualization with big data. In addition to Blender’s interactive user interface, it offers programmers an embedded python console where you can make your work by using either user interface or writing a python script.
We first started to render the parts of a mitral cell. We defined each segment of apic, soma, tufts and dendrites as a cone object in Blender. Each mitral cell has 600 segments in average and the number of granule cells related to that mitral cell is 1100, in average. The neural network which we visualize is made of 635 mitral cells and 698500 granule cells. In total, we have 1079500 numbers of segments. We first created an object for each segment. The first problem that we faced was scaling problem. Creating objects in this number made the rendering very slow. The code was getting slower as the number of objects in the scene are increasing. Blender has operators (bpy.ops) for the users using graphical user interface. It is not advised to use these operators in python scripts. That’s why, we changed our approach and used bmesh module. Bmesh module offers more flexibility and features to render meshes. A mesh is a collection of vertices, edges, and faces that describe the shape of a 3D object. The procedure to render an object is: creating a mesh, creating a bmesh, put the mesh (in our case it is cone or sphere mesh) into bmesh, take out the mesh from bmesh, create an object by giving the mesh, apply coloring and shadow to the object. With this approach, we got rid of the warning “called in an invalid context” which says you are not using operators in their intended use. This approach made the rendering a bit faster. However, it didn’t solve the scaling problem. For example, rendering a hundred of mitral cells in Pico weren’t terminating. Then, we understood that the reason of the scaling problem was when adding a new object with a mesh (object data) into the scene, updating the scene is internally done. Updating the scene means every time when a new mesh is added, Blender checks every mesh in the scene if it is modified or not. As the number of meshes in the scene is increasing, the number of objects to be updated is increasing which causes slowness. That’s why, we decided to decrease the number of meshes in the scene and created a group including segments for each part of a mitral cell. We are creating a single object and mesh, and adding the geometry of segment into the mesh iteratively. This approach solved the scaling problem. Instead of creating 1079500 objects, we create 635×5 = 3175 objects in total. We applied the same procedure for rendering granules. Although granules are not connected to each other, we are able to render in a single object and mesh even if granule cells have some speed problems. Surprisingly, we realized that we don’t need a supercomputer to render the whole network. That’s why, we didn’t need to make the code parallel at this stage. Rendering a hundred of mitral cells takes 98 seconds. Rendering all mitral cells takes approximately 24 minutes in a personal computer!

A single mitral cell with granule cells
A hundred of mitral cells from a different perspective

All mitral cells
The second stage of the project after rendering the whole neural network was to implement coloring for the segments in order to have an animation showing the propagation of electric pulses through the network. During the simulation interval, some part of the network has electric pulse which we aim to show it in a proper way. NEURON produced time data for every segment of somas, dendrites and granule cells during the simulation but not for apics and tufts. For this reason, we created fake time data for apics and tufts. Blender has a material for an object, where we can assign a color for an object. Since we create a complex object not a primitive one, we were not able to assign a color for every segment that has time data. When we assign a color for an object, for example the dendrites of a mitral cell, all dendrites were making the same color. However, we needed to show the propagation of electric pulse through the dendrite. That’s why, we implemented texturing. You can think of a texture a NxN matrix. Every element of the matrix is called as a pixel and refers the RGB value of an segment. With this approach, we are able to make coloring for the whole neural network. During the coloring stage, we faced speed problems since there are many segments that are needed to be changed their colors in the scene. That’s why, we implemented caching mechanism to make the animation in a faster way.
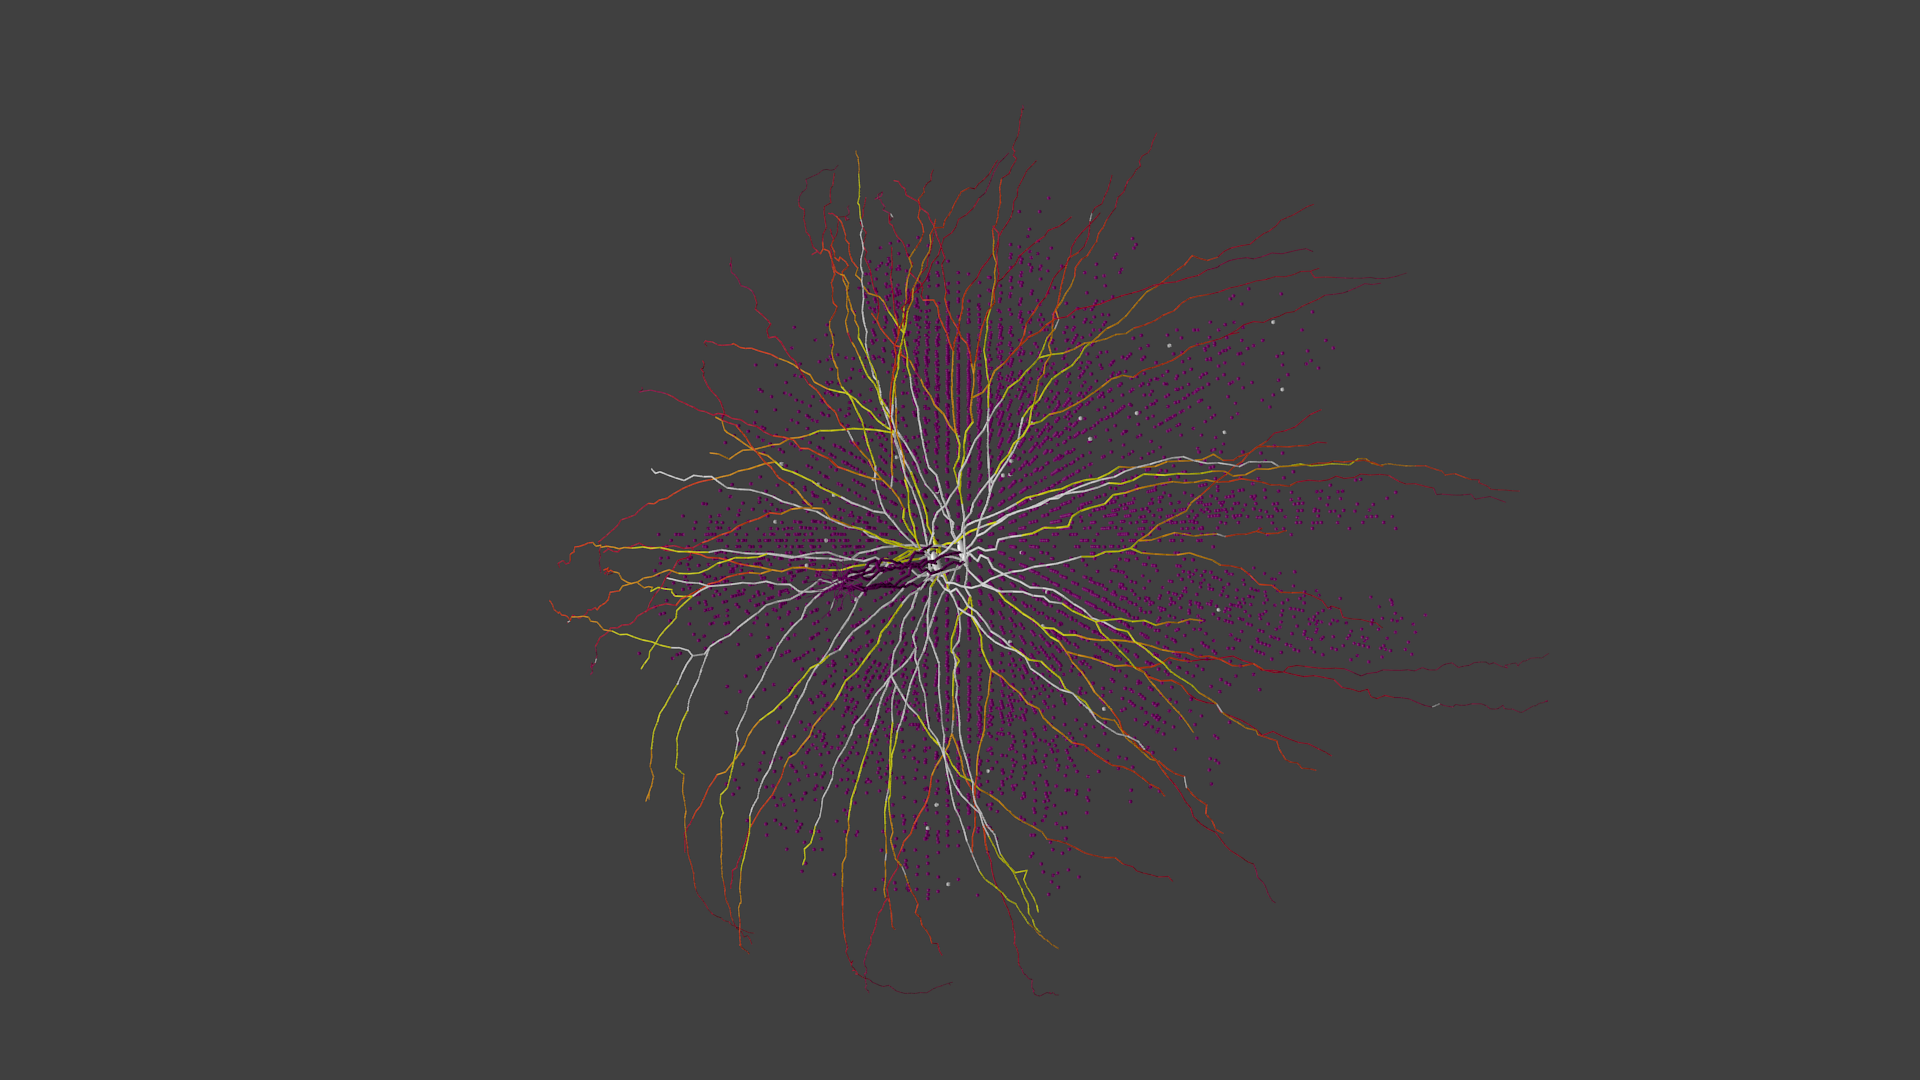
We have thirteen different types of colors. The essential colors are purple, dark pink, red, orange, yellow and white. The colors represent the voltage level that a segment has. The color of purple represents the segments that have no time data. The voltage level is increasing through purple, dark pink, red, orange, yellow and white, respectively. The coloring steps of a few mitrals is following:


The third and the last stage of the project was implementing an interactive and adaptive user interface to make managing the program easier for users. We are aiming to give users additional information about data and to provide them some flexibilities. For this purpose, we created a custom panel in Blender that enables an user to select mitral cells s/he wishes to animate. Users can select mitral cells from the scene interactively. The panel also allows an user to select which parts (tufts, apic, soma, dendrites) of mitral cells as well as granules s/he wish to include into the animation. Instead of animating all the parts of all mitral cells and all granule cells, users can select a small part of the whole network which s/he finds more interesting. The duration of the animation is 200 minutes and we are using 300000 frames to show the electrical propagation in a more realistic way. That’s why, we will add another button into the custom panel which allows the user to animate the selected mitrals and their parts in a specific duration of time. Another feature that we added is to create a curve that shows the number of mitrals that has time data by a frame id. This feature can help users to select the time interval.

Number of active mitrals during the animation
I would also like to mention CINECA and its working environment during the last days of my internship. CINECA is a supercomputing centre in Italy. It has three supercomputers Fermi, Galileo, and Pico. Fermi will be soon replaced by a new one, which will be the fastest computer in Italy. The office that I am working is called SCAI (SuperComputing Applications and Innovation). It is full of helpful, kind and talented people. Most days, the employees bring the office some dessert. They even come by your desk with them. My mentors are very motivated about my project. They have been interested in it a lot and have given advices in each stage of the project. I am very grateful for the chance to work with them. All in all, I am very grateful that I attended SoHPC and have become a member of this vibrant community. It provided me a chance to work for two months in such a nice working environment with the great people.

Leave a Reply