Web visualization of Energy load of an HPC system

Project reference: 1705
Energy Efficency is one of the most timely problems in managing HPC facilities. This problem can be addressed at different scale and from different perspective: chip and board design, cooling technologies, batch scheduler tuning. In order to help insight and tuning, fine grained monitoring of cluster status and activity is believed to be of great importance. Our research group has already developed and deployed a lightweight scalable technology to collect physical parameter and scheduling status of several observable, up to the single core temperature an job id running, with temporal frequencies in the order of few seconds. While the ultimate goal of this data collection will be the automated maximization of energy efficiency, our research group is currently focusing on real time and historical analysis of the most important observables. While large statistical data analysis will be of much use, we believe that this data analysis task could benefit from a finer grade, real time, physical mapped data representation of the required observables (e.g. the numbers of job running, average temperature of the CPUs per job, top temperatures and so on). Within this project we propose to explore interactive web visualization techniques to browse the collected data using proper visual presentation. The final result will be a web application presenting cluster status. This application will target: (i) both system administrators and researchers trying to tune available parameters for optimizing efficiency, (ii) HPC users for monitoring system and job status and finally (iii) the large public for dissemination purposes.
Simple Blend4web model of CINECA phisical cluster layout
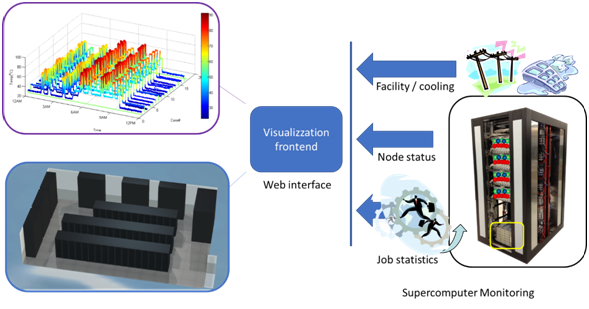
The picture represents on the left a supercomputing installation augmented with fine-grain monitoring back-end and on the right a visualization front-end. The monitoring system regularly collects statistics on jobs entering the system, on the status of computing nodes (load, temperature and power consumption) and on the facility operating conditions. These values are fed into a web-server which serves as visualization front-tend. The visualization frontend aggregates the multi-scale and multi-physics information into informative graphical view of the supercomputing status, usage and efficiency
Project Mentor: Dr. Andrea Bartolini
Site Co-ordinator: Dr. Massimiliano Guarrasi
Learning Outcomes:
Increase student’s skills about:
- Web technologies (e.g. javascript)
- Python
- Big Data Analysis
- Blender
- HPC schedulers (e.g. PBS)
- Internet of Things (MQTT)
- HPC infrastructures
- Monitoring of Energy efficiency
Student Prerequisites (compulsory):
- Javascript or similar web technology
- Python or C/c++ language (python wil be preferred)
- MPI
- PBS
Student Prerequisites (desirable):
- Cassandra
- Apache Spark
- elasticsearch,graphana
- Blender
- Blender4Web
- MQTT
Training Materials:
None.
Workplan:
- Week 1: Common Training session
- Week 2: Introduction to CINECA systems, small tutorials on parallel visualization and detailed work planning.
- Week 3: Problem analysis and deliver final Workplan at the end of week.
- Week 4, 5: Production phase (set-up of the web page).
- Week 6, 7: Final stage of production phase (Depending on the results and timeframe, the set of observables will be increased). Preparation of the final movie.
- Week 8: Finishing the final movie. Write the final Report.
Final Product Description:
An interactive web page will be created. This page will show a series of parameters related to energy efficiency of a HPC system. This web page will be also used to show some statistics about the jobs running in the selected system.
Adapting the Project: Increasing the Difficulty:
We can prepare a 3D rendering of the HPC cluster, via Blender4Web in order to visualize the energy load directly on the cluster.
Resources:
The student will have access to our facility, our HPC systems, the two databases containing all energy parameters, and job information. They will also manage a dedicated virtual machine on our PICO HPC cluster.
Organisation:
CINECA
![]()

Leave a Reply