When Big Data Becomes Too Big

As a guy from Central Europe, upon arriving to Bologna my first reaction wasn’t subtle: “Damn, it’s hot!”. After two weeks of getting used to the weather, I can say that I am still boiling. I will return to temperatures once more in this post, but in completely different way.
Bologna, the city of food. You can guess what the first thing we did was when we arrived at our apartment. Dropped the bags and right away went for the famous spaghetti alla bolognese. And I can tell you, they were superb! The “summer body” term has a completely different meaning for me now…
I can talk about all the amazing food, drinks, architecture and people all day long (the best thing for this is to follow me on Instagram) but let’s get to what I am actually doing this summer – apart from getting fat.
CINECA and Galileo Supercomputer
My Summer of HPC project focuses on visualizing a HPC system’s energy load at the CINECA facility. In less cryptic words, we monitor a lot of metrics regarding the whole HPC system starting from the core counters to temperatures and cooling of the whole room where the supercomputers are.
Currently, we are working on the Galileo supercomputer – which is the 281st most powerful supercomputer in the world, and we are monitoring only about an eighth of its nodes (64 of 516).
Now we get to the more technical and interesting part.
The metrics we measure are of several types, i.e. environmental metrics (mainly temperatures in different places and levels), performance metrics (such as core loads, instructions per second) and many others. Actually, there are more than 50 metrics which are being monitored right now. All these are usually measured every 2 – 10 seconds and are sent via the MQTT protocol to a database cluster which stores it for 2 weeks. You may ask why store these for such small amount of time? The answer is simple. There is a lot of data. Each day the system produces around 60 GB of data. That is a lot of data to store and keep in the long run.

Some of the data that we are receiving in 2 seconds samples.
Now that we have all the data, what should we do with them? Visualize them of course! Here’s where I come in as the savior. I am creating a web application that takes the data and shows it in consumable format, mainly charts or as one single number. Of course, I am not showing all the gigabytes of data we have, only a very small portion of them which is usually defined by the job that runs on Galileo. This way it can show in a couple of different scenarios. A programmer is more interested in how their program performs and a system administrator cares about the temperatures and loads. This gives us an uneasy task of deciding what data should be shown.
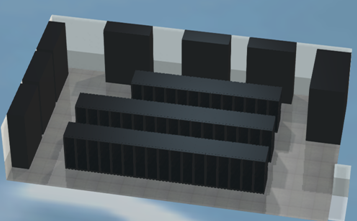
3D model of one of the cluster rooms at CINECA
All of this will eventually be displayed in a sexy interactive 3D model of the Galileo supercomputer. The good folks from CINECA already did the boring part, and the model is prepared for me to play with and still, everything will be in a browser. So once you run a job on Galileo you can actually see the physical position of the nodes on which it runs, how it behaves and how it influences, e.g., temperatures and power consumption of the nodes. Cool, huh?
In the long run, this web application can help people around HPC to realize how much energy and resources is needed to run their applications and make them focus more on the energy impact of their doings.

[…] my previous post it was all just dry theory and nothing to show (apart from a great food picture). Today the post […]