Sophie’s World, Chapter 2: The project
In case you have cheched out this video, you might be wondering what this project is all about. In case you haven’t, I will wait for you 3:33 minutes to see it and return 🙂
Ok, now a little background story for the idea of the project. The visualization group of BSC has been involved with music projects and it took part in Sónar+D of 2016.
All the electronic music fans and many more know the Sonar Festival. In case you don’t, Sónar is the International Festival of Advanced Music and New Media Art taking place in Barcelona during three days every June. It has a both night and day music events, and along with Sónar by Day, is Sónar+D. Sónar+D is the international conference that brings together creativity and technology.
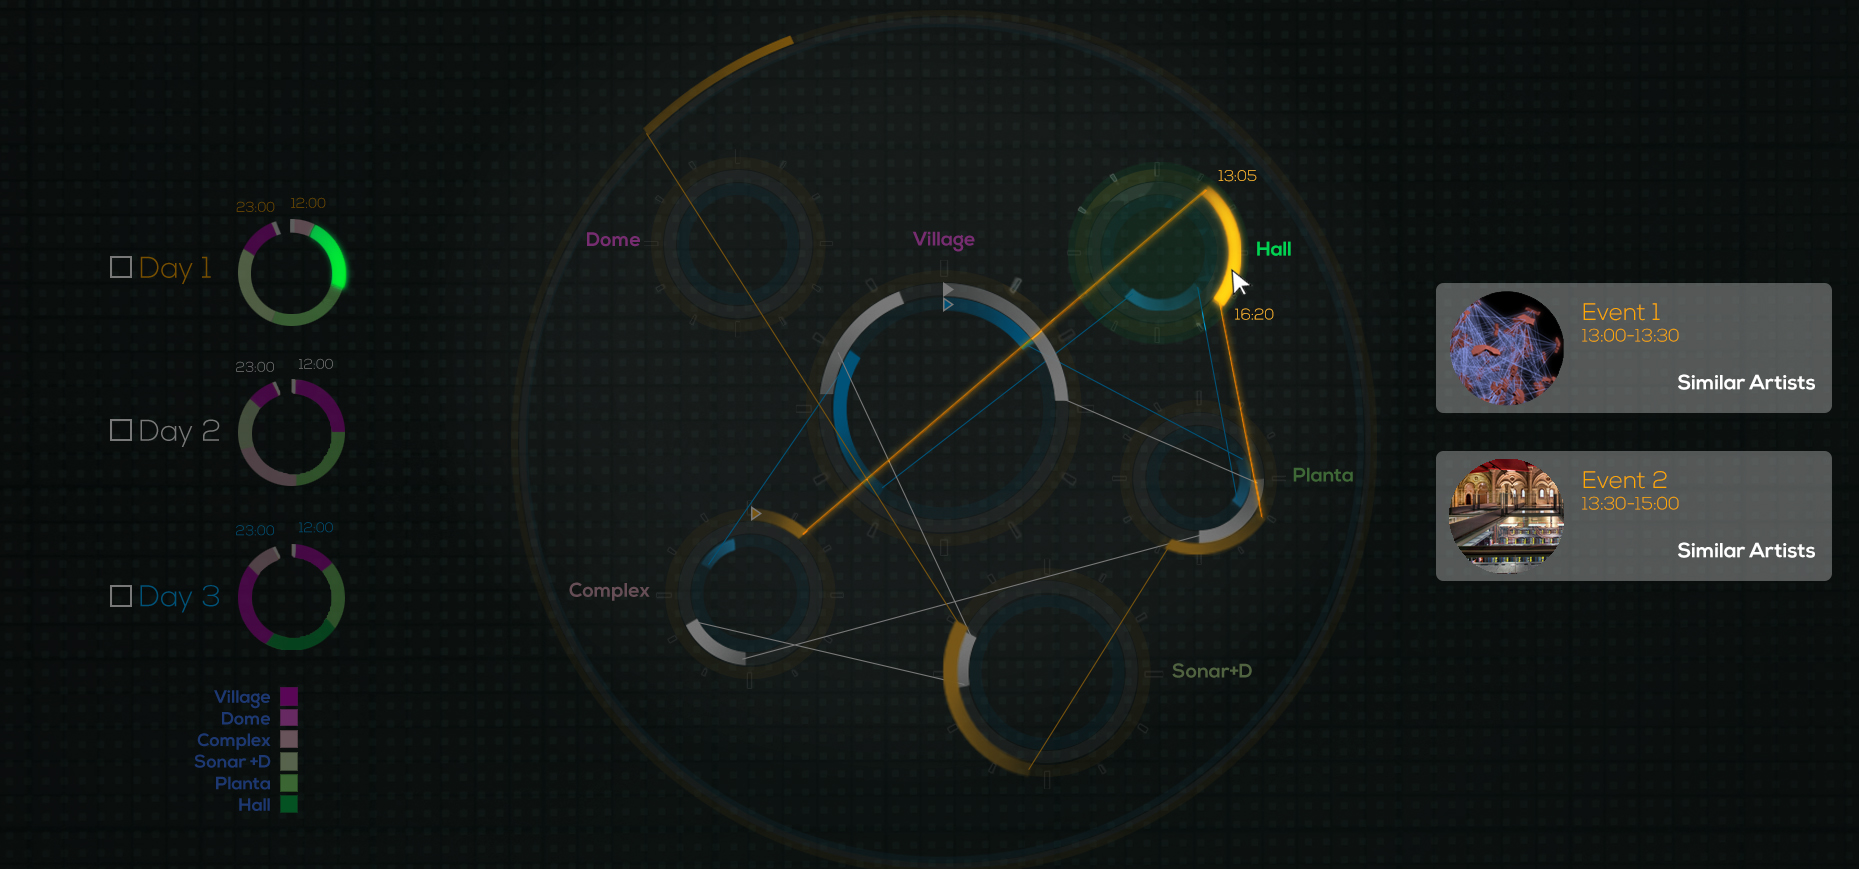
They know what you did!
So the great scientific visualization group of BSC-CNS was there, creating a project called “We know what you did”, by deploying at Sonar by Day a network of sensors to detect and follow wireless communication devices (like mobile phones), and making a real time analysis of how they move around the space of the festival.
Ok, but what I am doing there? Well, their love for music inspired the project for classifying artists’ discographies. Up to now, several scientific papers and methods have been proposed for classifying music genres. But what happens if we want to know more, not just about a single genre, but about an artist? Our goal was to classify similar songs into groups in order to see the variety of their music. Or if you have a specific song that you like from an artist, you can see similar works by them. Cool, isn’t it?
Beginning with the discography of an artist with a long career, we analyzed the songs extracting features that describe them. Then,after we perform a data analysis, we were able to group songs by similarity. The stages can be seen from this image:
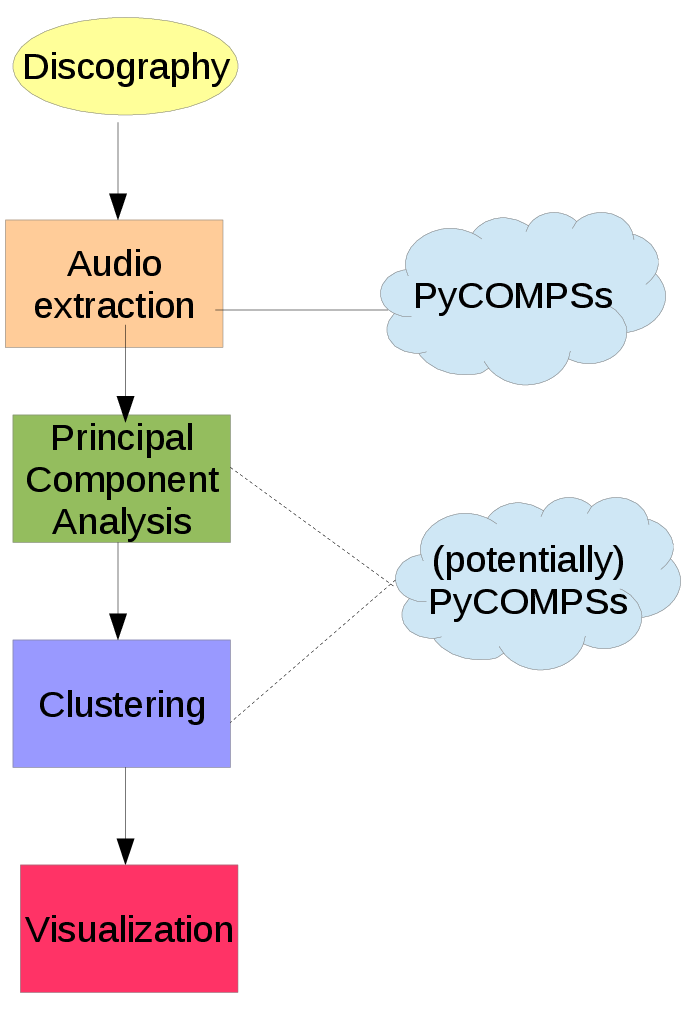
The stages involved for Discography classification
The audio extraction is used to get audio feature sets that are evaluated in their ability to differentiate. The feature sets include low-level signal properties, mel-frequency spectral coefficients (MFCC). Low-level signal parameters refer to a physical description of a song. MFCC is commonly used in voice recognition and is based on human hearing perceptions.
At the end, each song is described with 72 features.
Not all these information is useful and at the end, only a small percentage of them contributes to the final result. We use Principal component analysis (PCA), a statistical procedure used to emphasize variation and bring out strong patterns in a dataset, meaning that if a feature’s value doesn’t change a lot, then it’s not useful.
By keeping 99% of the original information, sometimes we ended up having only 2(!) useful features.
Now that our data is pretty, clean and tidy, we move to clustering. Cluster analysis combines data mining and machine learning. What we try to do is grouping similar songs. Songs in the same group (called a cluster) are more similar to each other than to those in other groups (clusters).
But how do we know which is the best number of clusters? Science is here to save the day, using a metric called silhouette width, which indicates how well the clusters are formed. Silhouette width has a range [-1,1], and a value close to one means that items inside the groups are very similar among themselves, and groups are well separated.
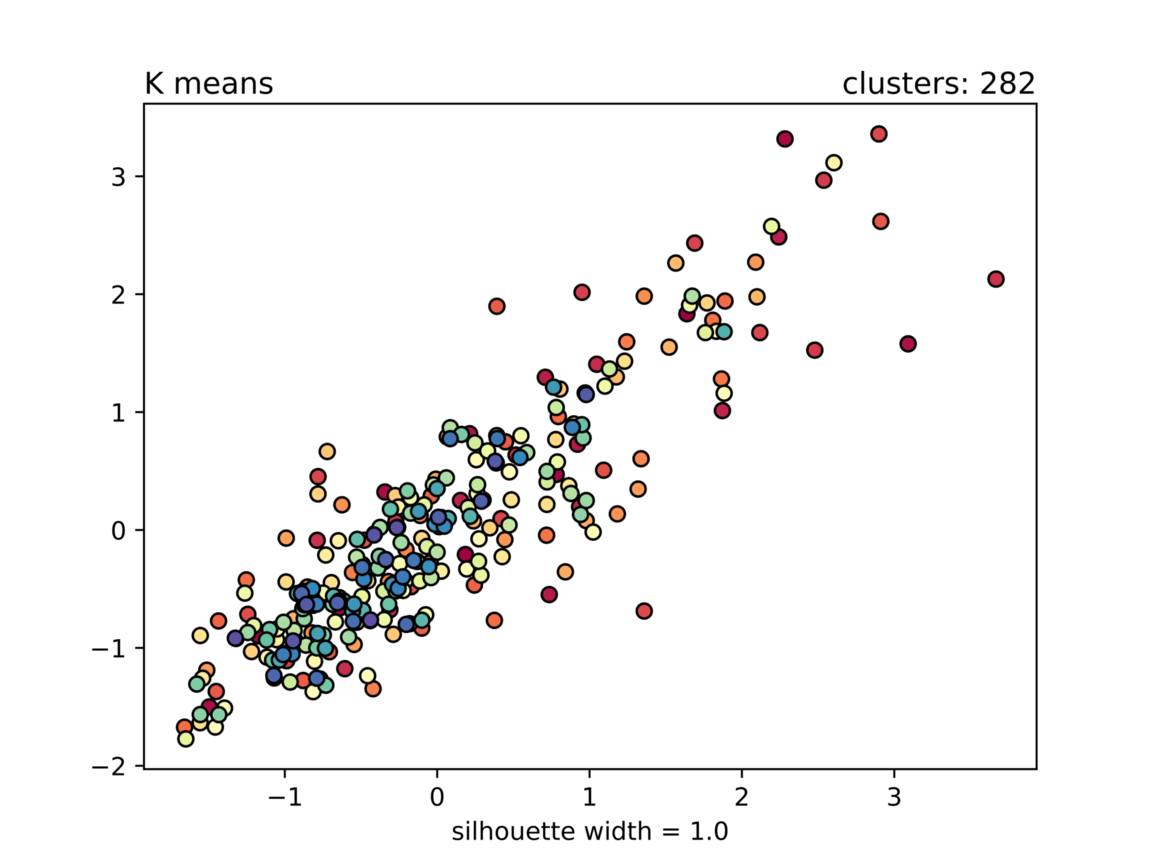
David Bowie clusters using the K Means clustering algorithm. The clusters are very merged and not a clear data structure was found
But at the end, all these are just mathematics. Clustering methods lack the intuition and human inspection is necessary on how the clusters are formed and making a determination based on an understanding of what the data represents, what a cluster represents, and what the clustering is intended to achieve.
For performance and to exploit the potential of MareNostrum, Barcelona’s supercomputer, we used PyCOMPSs to parallelize the audio extraction stage. The BSC has developed COMPSs, a programming model and runtime that aims to parallelize sequential applications written in sequential programming languages (like C, Java, Python). It makes parallelism easy even for those that don’t have a strong programming background! Although in our case it was not necessary because of the small number of songs per artist, PyCOMPSs could also be used in the PCA and clustering stages.
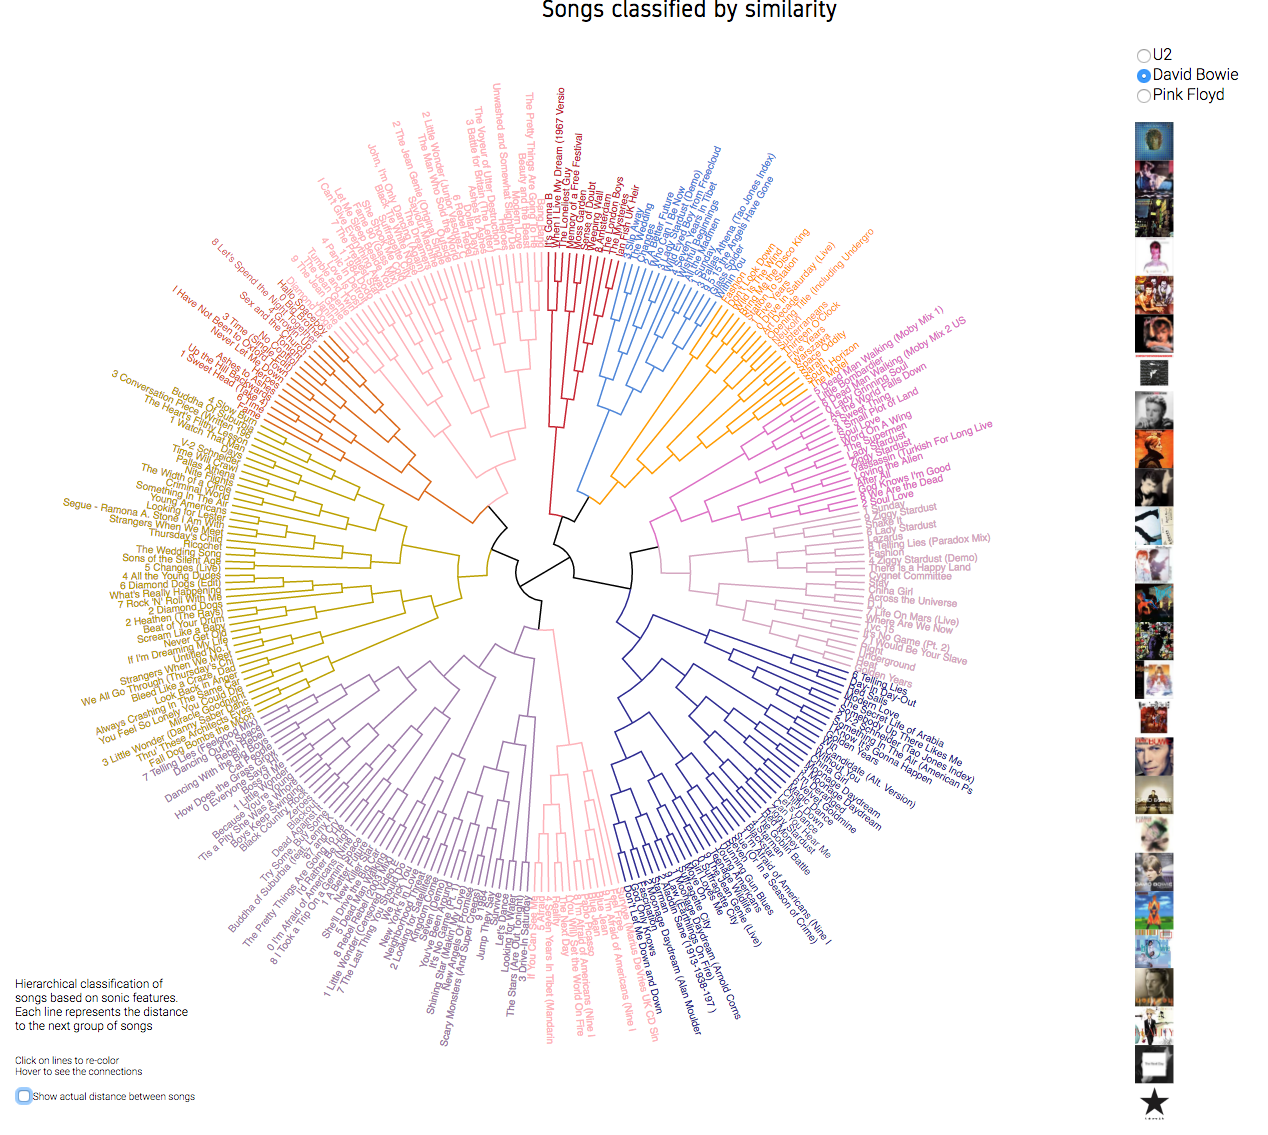
We better understand data when we see them. The data is brought to life using web technologies like HTML, CSS and javascript library D3, producing dynamic, interactive data visualizations in web browsers. The vizualization is the result of the cluster analysis, using a default coloring, but giving also the user the possibility of defining their own clusters.
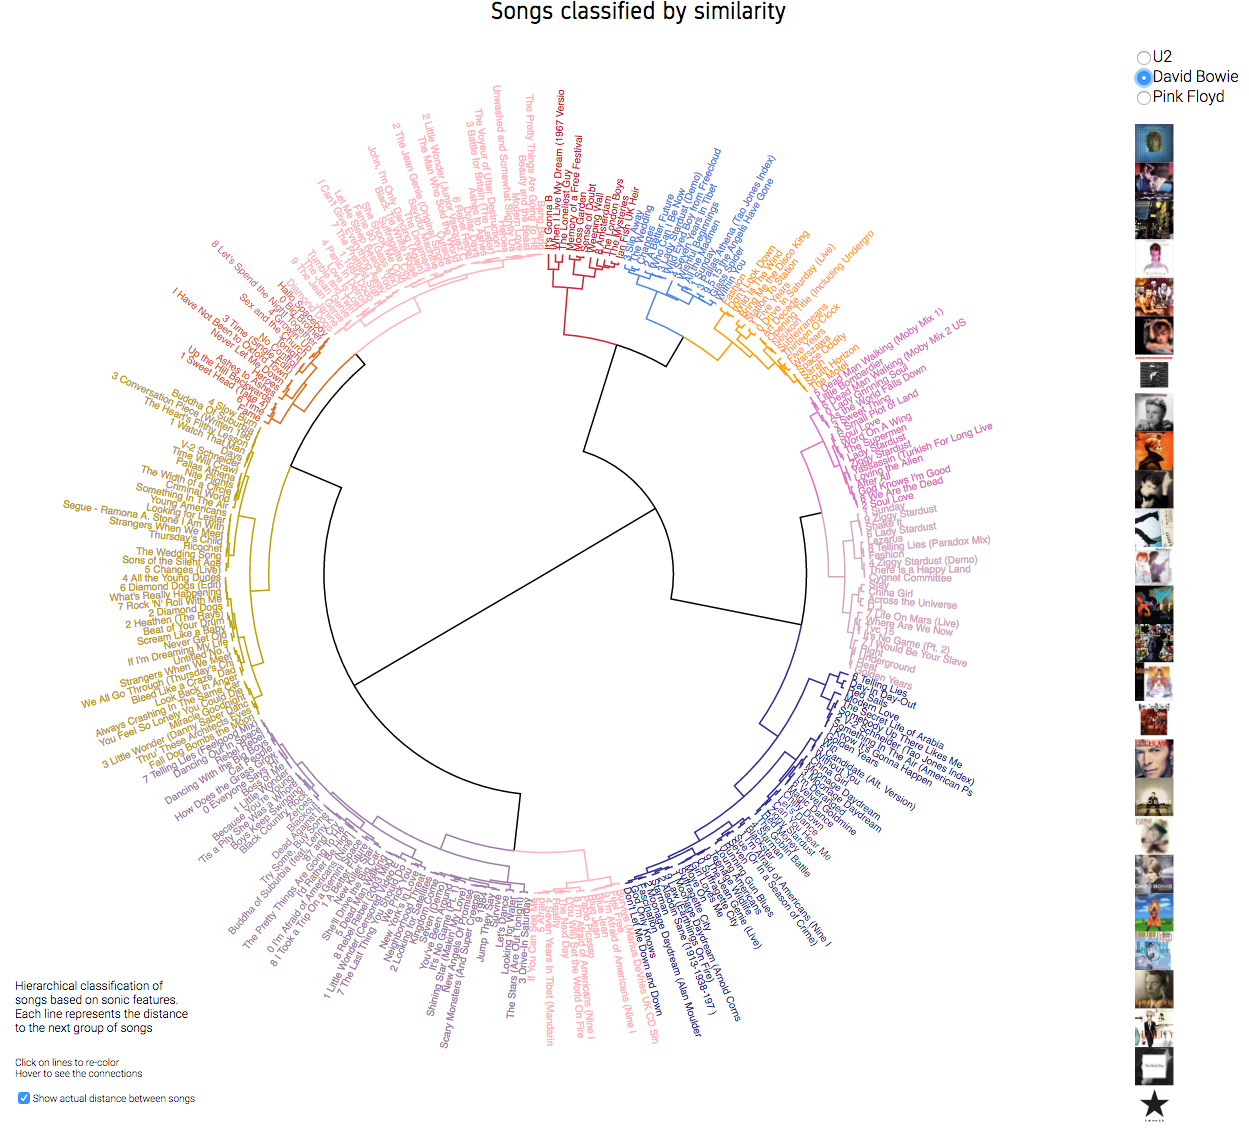
David Bowie. Default coloring
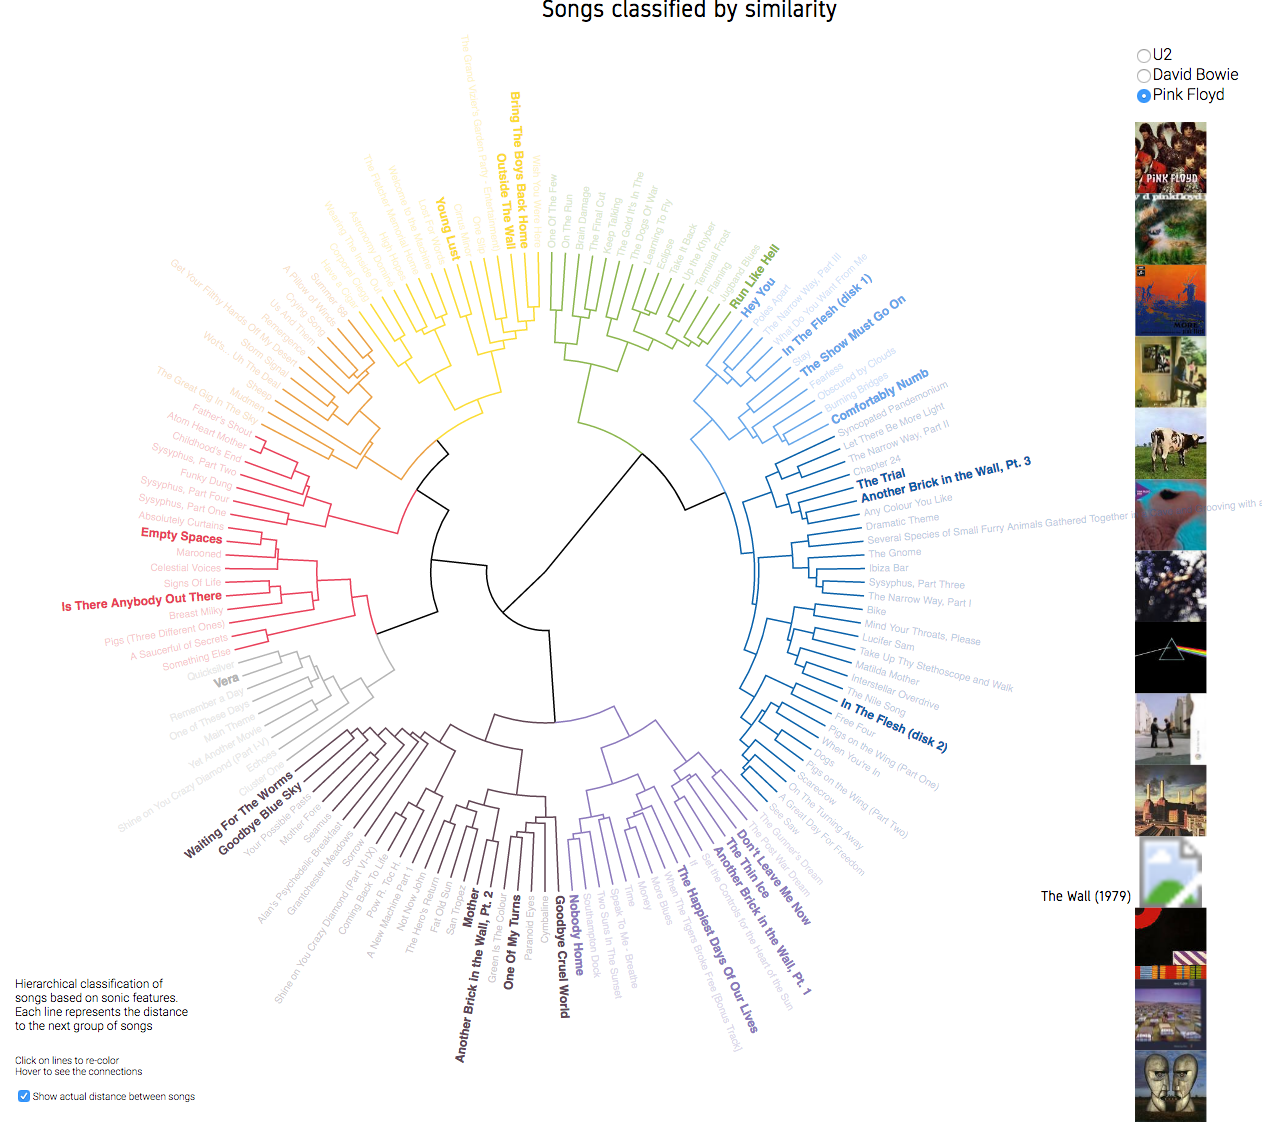
Pink Floyd. The wall (1979)
You can see the results and play more with the artists here! Vizualization result
