A picture is worth a thousand thousand tiny numbers.
This week I decided to talk a bit more about my project. Here at IT4Innovations they have innovated a program abbreviated ESPRESO (ExaScale PaRallel FETI SOlver). It is a highly efficient solver that contains FETI based algorithms. FETI, other than sounding like a delicious Greek cheese, is an abbreviation for ‘finite element tearing and interconnecting’ method. FETI is basically a method for solving systems of linear equations. The program is highly parallel, meaning that it can be ran on multiple cores to a high degree of efficiency, making it perfect to use on the supercomputer.
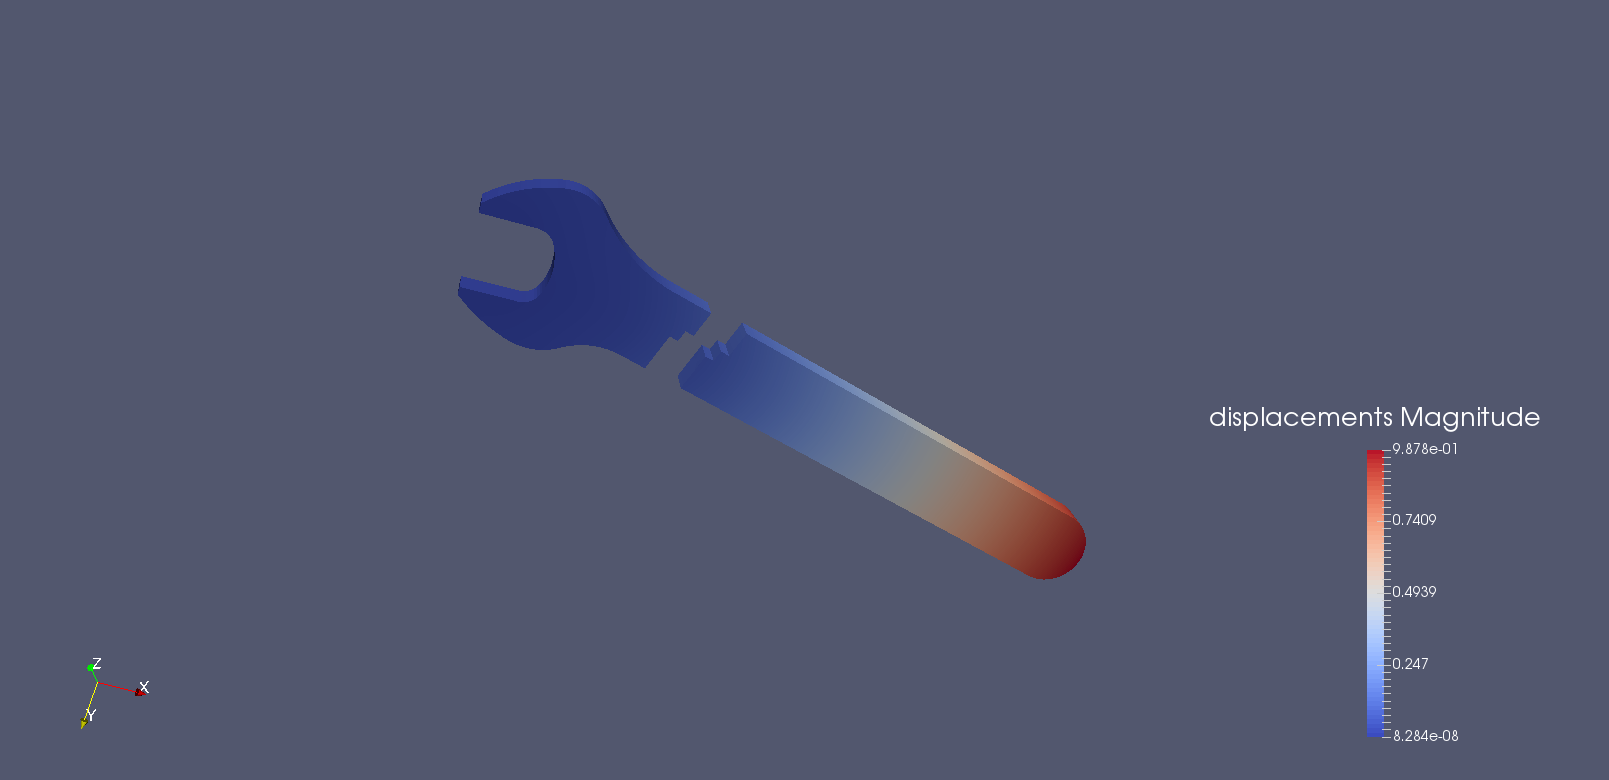
Produced using ESPRESO. We can see that this image gives so much more than the shape of the object.
All these details are mostly ‘behind the curtain’ as far as my project is concerned. Paraview is used to visualize the results produced by ESPRESO. To make 3 dimensional visualizations of data the program must produce a mesh, which defines all the aspects of the object. Two important data types give the structure of the object: 1) Points: we must have an array of points which outline the shape at, for simple cases, uniform intervals. Each point has three associated values: its x, y and z coordinates. 2). Cells: these will be the most fundamental element of the image and will typically be the smallest uniform shape that can fit between points. Now that we have the structure; we can make cool visualizations of 3D objects as seen in the caption to the right. But wait, there’s more! The slick colours we can see in this image are not just to make it look groovy (although it does look groovy). They are telling us something about the data. What is it telling us about the data? Anything we want to know; pressure, heat, velocity, displacement (as in this example) or acceleration. This information must, of course, be produced by the ESPRESO and put in the right format, which can be, as in this example, a value for displacement for each point in the structure. We can now see the purpose of visualization. We can directly see the information in which we’re interested. This is essential for understanding massive data sets that are far too complex for the human brain to picture, not to mention analyse!
So where do I come in? ….’through the door I presume’…
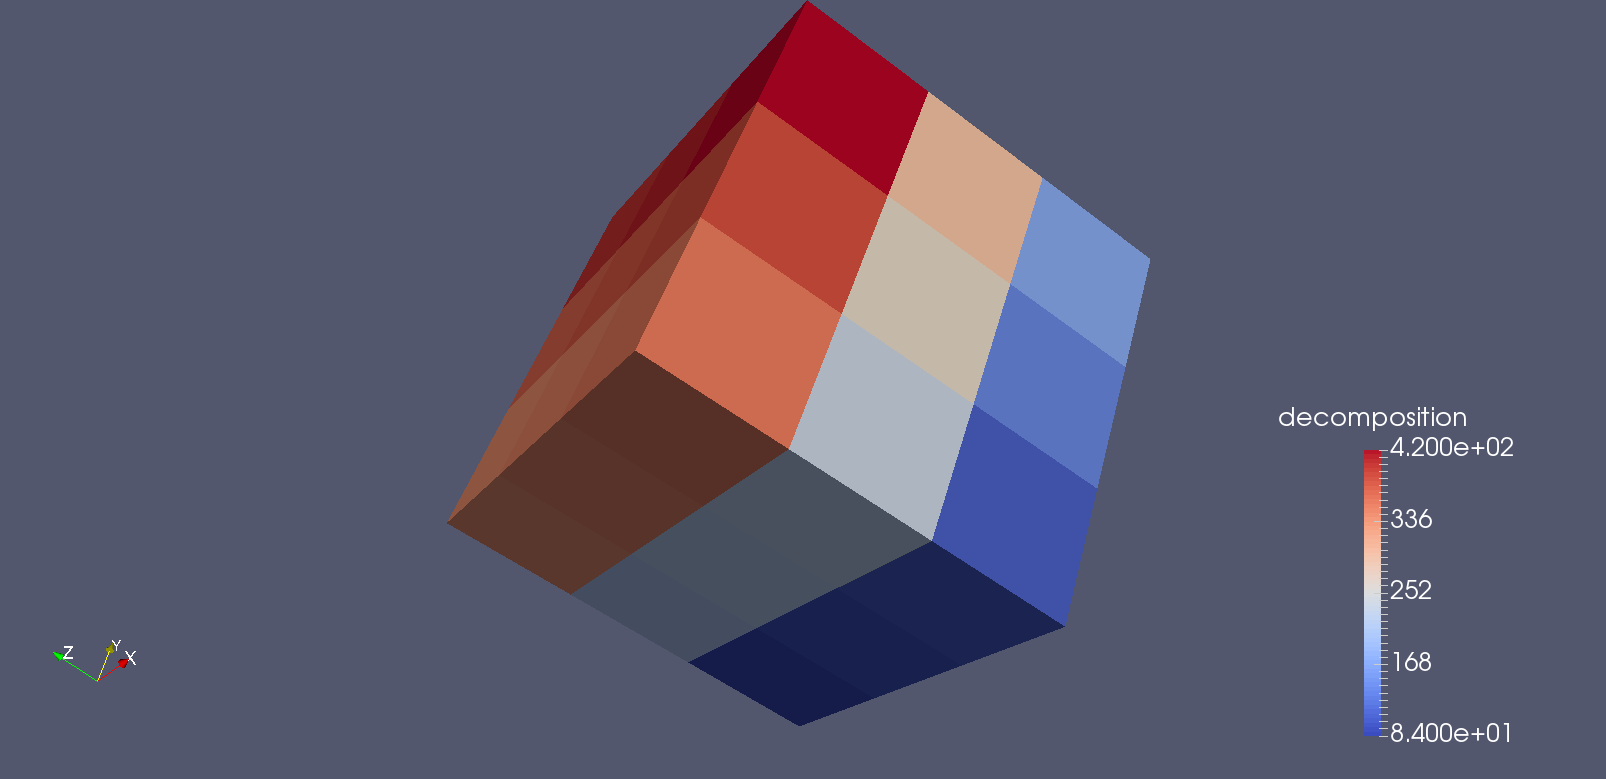
Descomposition. This is an example of cell data on a very small data set.
The ESPRESO is already configured, by the developers, to output it’s results in a mesh to a vtk (visual tool kit) file which allows Paraview to read and display it in a direct way. This is the de facto standard way of visualizing data. But as we see from the discussion above, this means we must record massive amounts of structural information when we might ultimately only want to know something about one characteristic of the data. Furthermore, we might slice and dice the image using Paraview’s advanced tools and output a very small data set compared to what we needed to save to produce the visualisation. In this case we can see that the massive vtk file can be considered cumbersome. THIS is where I come in. My project is to adapt the ESPRESO code such that it does not write the data to a vtk file but instead passes the datastructure directly to Paraview. This is called ‘real time’ visualization. The part of Paraview that supports this form of visualization is referred to as Catalyst.
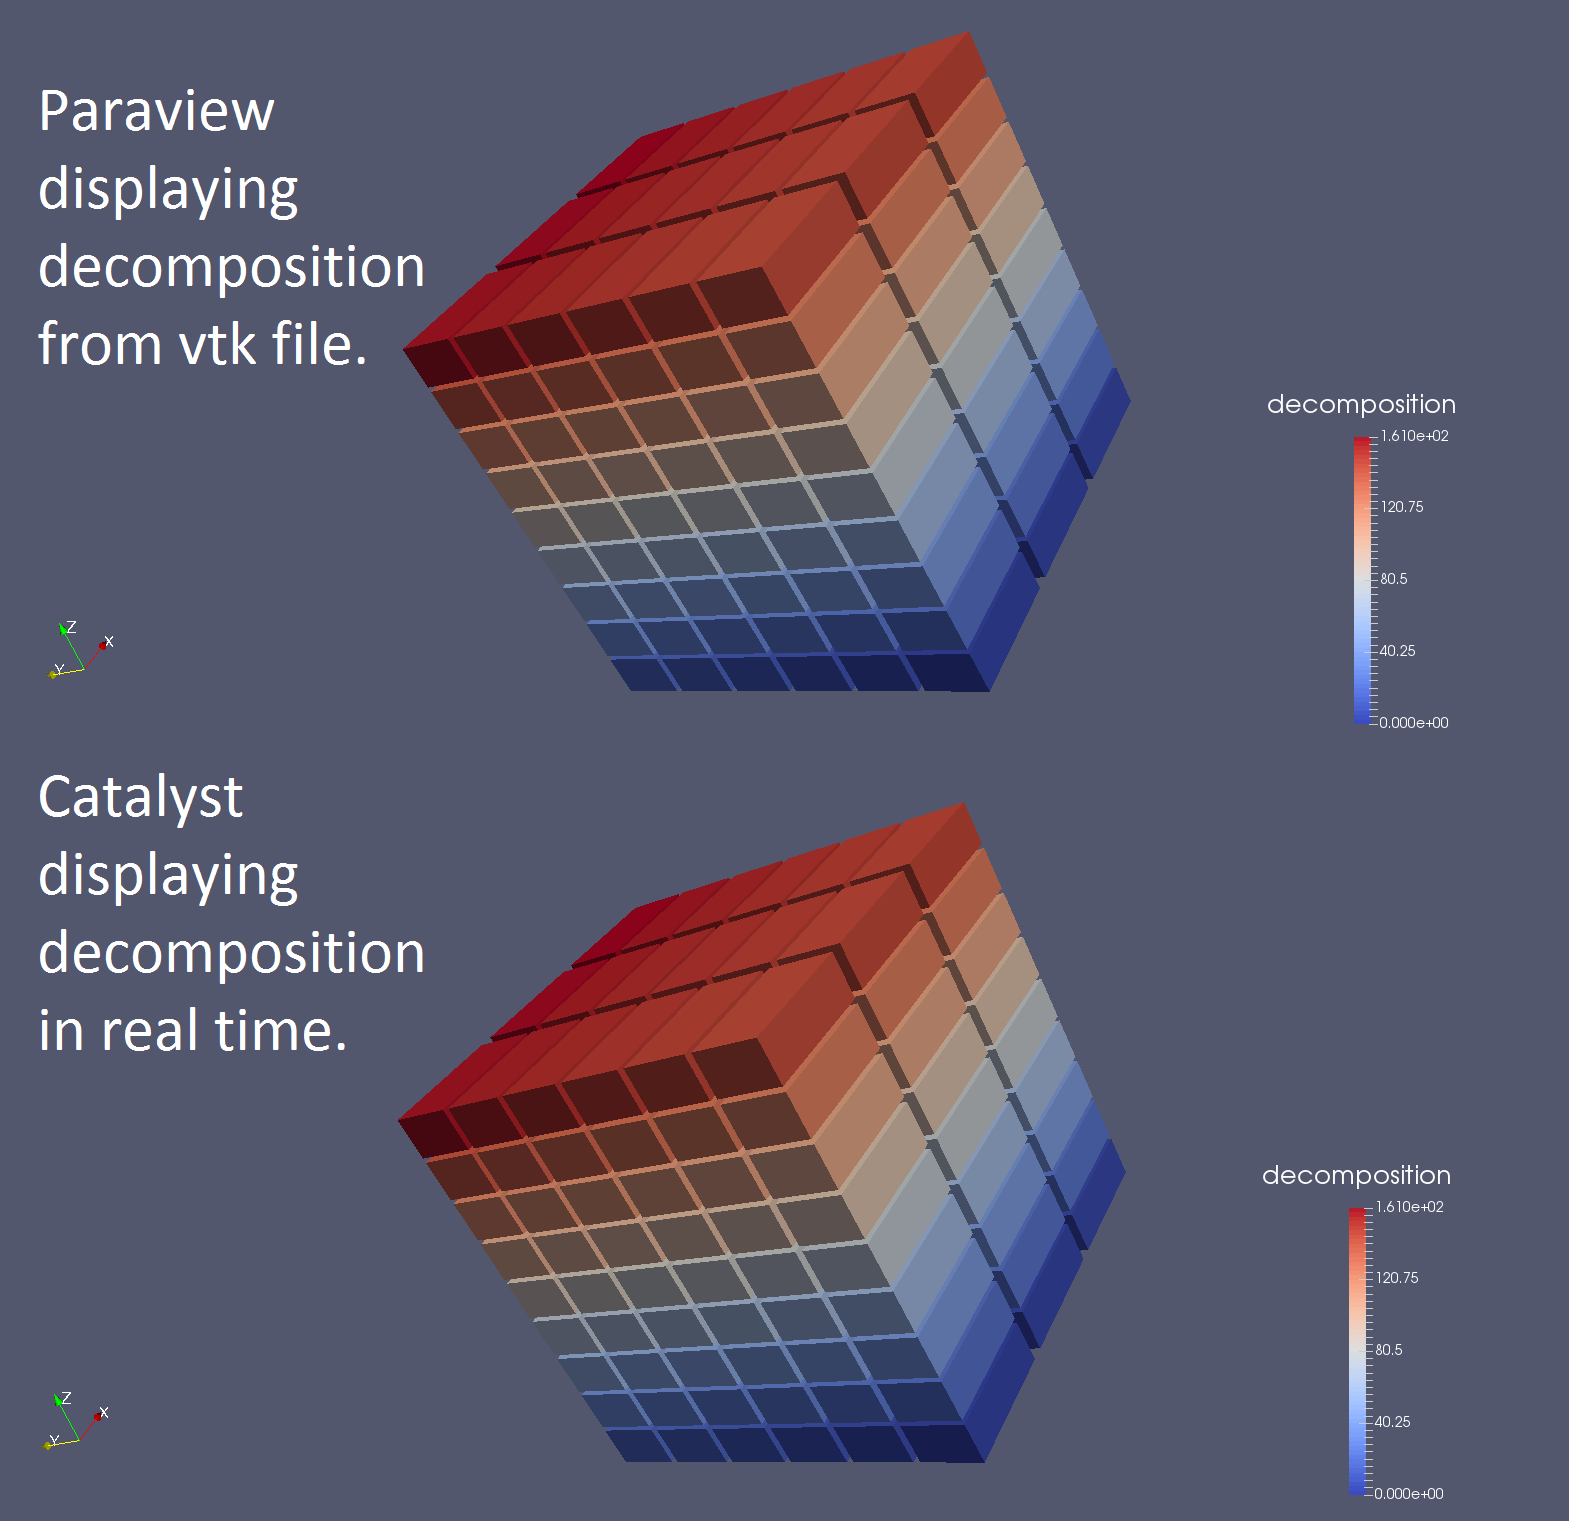
Will you ever know if these actually are not the same image, or if I’m just fooling you?
What is the difference between the two images to the right? One of them was produced from a vtk file ie. the data was written to file and Paraview created an image from the data. The second was produced using the same data except the data is not written anywhere! No file exists that contains the data for displaying this image. Instead, Catalyst and the simulation code are linked, producing and reproducing the data at each time step to keep the image displayed. My task has first been to make this link between the simulation code and Catalyst. The image produced by Catalyst is already taking as much ‘effort’ in terms of data Input/Output as would be required to produce a video of data which is changing, or evolving in time. Whereas the image produced from data in the file would require the same amount of data again for every time step the video would need, which is a lot- think of an animated film! (Hopefully you’re thinking of ‘How to train your Dragon’ right now? …classic…).
Fully linking catalyst to the ESPRESO code is a difficult task. I am currently running small simulations on a example c++. I am preparing an adapter code that will manage the communication between ESPRESO and Paraview Catalyst. At every time step the data produced by ESPRESO will be passed to this adapter code which shall put it in the correct format and pass it to catalyst.

Interesting, I thought ESPRESO was a type
of coffee!
Like the colourful 3D simulations…
Fun & informative..cool!!
goodread ++;
Enjoyed what I understood! Very interesting….