A HPC System and Web Visualization with Grafana

What is a HPC system ? High performance computing (HPC) is the use of parallel processing for running advanced application programs efficiently, reliably and quickly. Typical users are scientific researchers, engineers, data analysts.
In the race for Exascale supercomputer systems, there are significant difficulties that limit the efficiency of the system. Beyond all of this, Dennard’s scaling up energy and energy consumption through the end is beginning to show its impact on limiting the highest performance and cost-effectiveness of supercomputers.
A new methodology based on a range of hardware and software extensions for fine grained monitoring of power and aggregation for rapid analysis and visualization is presented by researchers. To measure and control power and performance, a turnkey system that uses the MQTT communication layer, NoSQL database, precision grain monitoring, and future AI technology is recommended. This methodology has been shown to be an integrated feature of D.A.V.I.D.E. supercomputer.
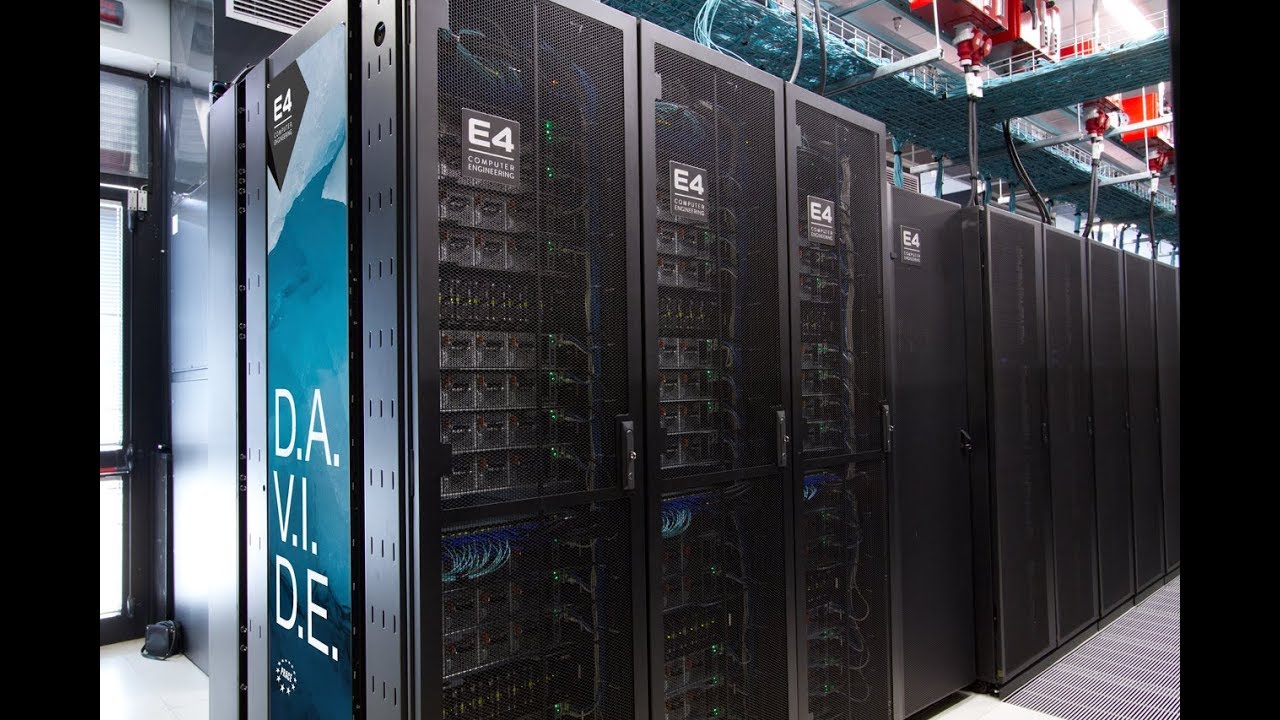
D.A.V.I.D.E. consists of 45 nodes that are connected efficiently. Infiniband EDR 100 Gbytes network connection, the highest performance of 990 TFolt total and estimated power consumption less than 2 Kwatt per node. Each node is a 2 Open Unit (OU) Open Computation Project (OCP) form factor and hosts two IBM POWER8 Processors with NVIDIA NVLink and four Tesla P100 data center GPUs and has an optimized internal node communication scheme for optimal performance. It stands at # 440 of the TOP500 list and # 18 at GREEN500 November 2017 list.
Energy Efficiency is one of the most common problems in the management of HPC centers. Obviously, this problem involves many technological issues such as web visualization, interaction with HPC systems and timers, large data analysis, virtual machine manipulations, and authentication protocols. Obviously, data analysis and web visualization can help HPC system administrators. To optimize the energy consumption and performance of the machines and to avoid unexpected malfunctions and abnormalities of the machines.
Some example grafhs on the Grafana
Grafana is one of the tools used for data analysis and web visualization and Grafana is open platform for beautiful analytics and monitoring and general purpose dashboard and graph composer. Grafana supports many different storage backends for a time series data (Data Source). Each Data Source has a specific Query Editor that is customized for the features and capabilities that a particular Data Source exposes. Although the use of Grafana seems a bit complicated, you will see that they will simply describe everything you’ll need when you follow the proper documentation. The link for youis : http://docs.grafana.org/
How I can use Grafana ? D.A.V.I.D.E has two databases ; Cassandradb and Kairosdb. Kairosdb is set up for Grafana as a datasource. Basically I can connect to the Grafana server and create and manage my dashboards from my script. Firstly I managed my dashboards as running dynamically. Also I need to managed them as statically. Because as statically without data source. I can visualize results of more data that doing that it is possible to use snapshot for grafana.
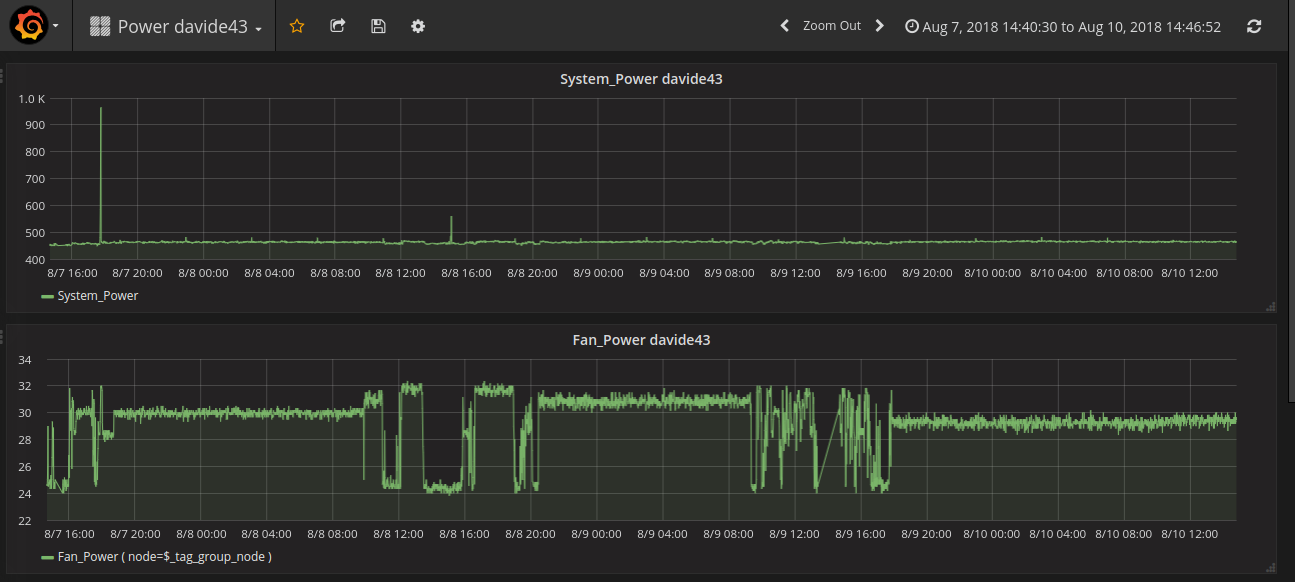
visualization Fan Power and System Power for Node davide43 as using line graph
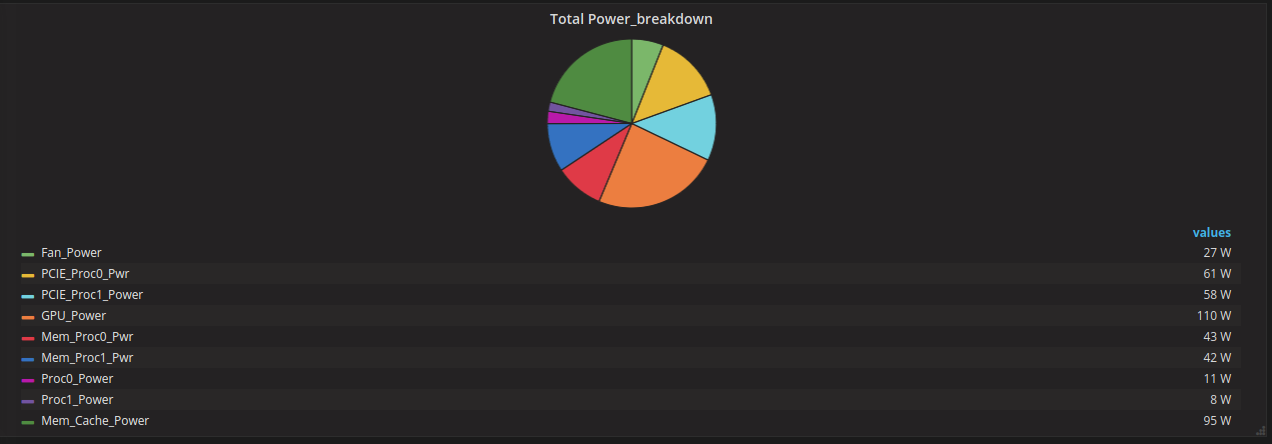
visualization total power of all metrics separately for nodes which has a job with using pie graph
Now, I am going to go and improve it. Ciao ciao 🙂
Hii! My name is Nazmiye. I am 24 years old. I am from Turkey and have studied in Turkey all my life. After high school I went to nursing school at my first university, but I didn’t complete the studies because I noticed that I liked to work with technology. Nursing didn't make me happy for me, learning a lot of new things all of time is exciting. Because of this, I decided to become an engineer and in my view, for me it was the correct decision. So I changed my major to computer engineering. This spring, I completed my Bachelor's degree in Computer Engineering at Dokuz Eylül University in Izmir. I worked as a developer on remote while studying for 5 months. I like taking part of voluntary projects. I like having making friends – both from Turkey and abroad. I did interrail pass in 2016 summer. Interrail Passes are the easiest way to travel to Europe's most amazing places by train. I like to explore new places.

Hello, did Grafana could replace Ganglia collecting Data from HPC clusters?