Discover how we can know the depth of the sea with just a photo!

Is it possible to know the depth of the sea just with a photo? How?
Yes, it´s possible. This is what I´ve been researching this summer and I´m here to explain you how I did it.
Introduction
We call the maps of the depth of the sea bathymetric maps. Traditionally, these maps are measured taking sensors to the ocean, like vessel-based multibeam sonar or active non-imaging airborne lidar bathymetry. However, these methods used to be expensive in terms of time and money and in shallow waters they are even more expensive. For these reasons scientists could only map about the 20% of the ocean´s seabed.
For measuring the depth in shallow waters there is an innovative and experimental technique that uses only satellite images. This technique can only be used in shallow waters and its accuracy is limited by different factors like the satellite image pixel size or the water turbidity . So, as I said in the title, with just a satellite photo you can measure the depth of the seabed.
How do they do it?
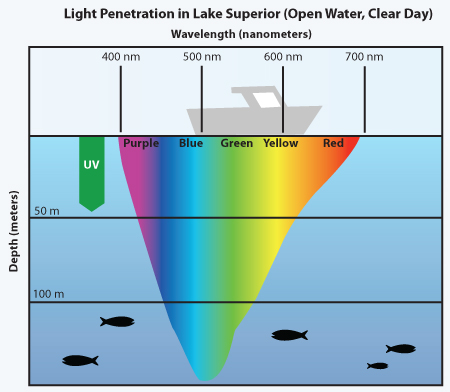
When sun light comes to the ocean, the different wavelengths are reflected in different proportions, and not always in the same way. Actually, ocean has not the same blue colour everywhere. Many factors like the impurities, the plankton, the turbidity or the depth, can change the spectrum of the sea. So, since depth is a factor that modifies the sea reflectance spectrum, it´s possible to study it just by looking at the water spectrum. In the visible spectrum range blue colour penetrates deeper in the sea than red or green. So, comparing the reflectance of the blue colour respect green or red we can get something called pseudo depth (pSDB) which is proportional to the real depth of the water. Figure 1 illustrates how different colours can penetrate into the water.
One way of look at the spectrum is using satellite data. In my case I used satellites Sentinel 2A and 2B that allowed me to study 8 bands in the visible and near infrared range, with a pixel size of 60x60m. I had two blue colour bands, one red and a green one, so I compared the two blue bands with the red and green bands obtaining a total of 4 pSDB combinations. If we know some real points in the area where we are working, we can convert this pSDB in a depth with a linear regression. I calculated the depth in North Adriatic and Calabrian Seas using more than 100 satellite images between 2020 and 2022. Then, I did an average of the calculated depths using those images where I got better results. That´s how I did the following bathymetric map of the shallow waters in the Calabrian coast.
On the next episode ….
Today we saw how I got bathymetric maps just comparing different colour reflectance bands from satellite images. On the next blog we will train an artificial intelligence to calculate bathymetric maps, we will study new band combinations and who knows, maybe I can discover something interesting.
Any comment or question it will be welcome.
See you on my next blog!

Leave a Reply