El Niño around the world

In my last post, I explained what El Niño events were about. In general, El Niño events are part of a bigger oscillation pattern in the climate of Earth called ENSO (El Niño-Southern Oscillation) that changes patterns in temperature and precipitations worlwide.
Being able to predict what their real consequences are around the globe is not easy, it takes a lot of time to evaluate if a certain anomaly in the weather in other regions is due to mere chance or if, on the contrary, El Niño events plays an important role on them.
Just to give an example, it is believed that, during El Niño years the summer monsoon in India is very weak and that the country is going to suffer from drought that year. Nevertheless, more deep studies show that, although El Niño years tend to be drier than average, the strongest El Niño of the century (1997-1998) produced a monsoon season with above-average rainfall. So, with these kind of figures, how to distinguish between causality and coincidence?
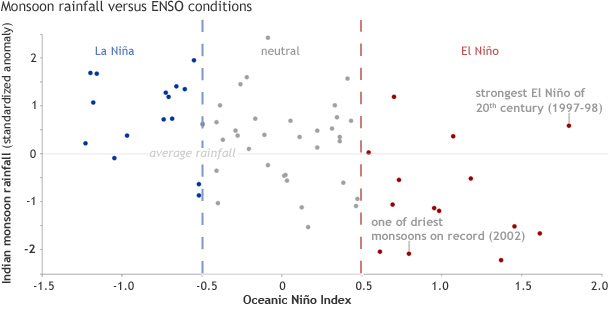
Comparison between the Oceanic Niño Index and the Indian monsoon rainfall from 1950 to 2012. Source: https://www.climate.gov/news-features/blogs/enso/enso-and-indian-monsoon%E2%80%A6-not-straightforward-you%E2%80%99d-think
What I have been doing all these weeks in Dublin (apart from getting plenty of rainfall myself) is try to figure out how these El Niño events have truly made an impact in other parts of the world.
The Pacific Ocean
The first question to answer is how it changes rainfall patterns in the Pacific Ocean (since ENSO originates there, it will obviously change something there) and that can be easily shown in the figure below.
Rainfall during December of several years regarding different states of the ENSO climate oscillation
We see that, during normal conditions, weather tends to be drier near the Pacific islands. During the cold phase of ENSO (La Niña phase), this pattern amplifies and the Pacific Ocean suffers from a dry month in December. However, during 1997 (the strongest El Niño year of the last century), this pattern changes drastically, implying a severe drought near Indonesia and nearby island and causing heavy rainfall in the Pacific ocean and Peru.
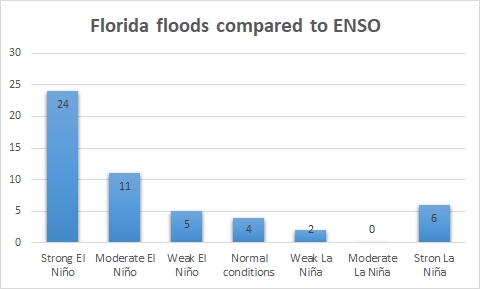
Correlation between floods in Florida and ENSO events. Source: https://www.weather.gov/tae/enso
The United States
But ENSO events also changes rainfall in the United States, where it can have either bad or good consequences. It is believed that there exists a correlation between rainfall in Florida and El Niño, which causes an increase in the amount of floods. Although, once again, it is difficult to say whether it is only a coincidence. On the other hand, California, which is a general dry place suffering from drought every once in a while, tends to have more rainfall during El Niño events which is good news for everyone living there.
Many more places to discover
Of course, apart from the places mentioned in this post (India, Pacific ocean, Florida and California), many more places can be affected by El Niño events and some correlation may not be as straightforward as others. Scientists should be careful about making statements when it comes to ENSO and, once discovered something, it is important to keep in mind that climate is one of the most unpredictable things the Earth has.
So, if you want to discover which other places are affected by ENSO events and how big this correlation is, do not miss my next post with more news about it. And in the meantime, I will leave you with an animation on how an El Niño event takes place. In the video below you will see how the temperature of the ocean rises in the equatorial Pacific Ocean at the end of 2015, which was one of the strongest ENSO events ever recorded.
