If you can visualize the shape, you can understand the system
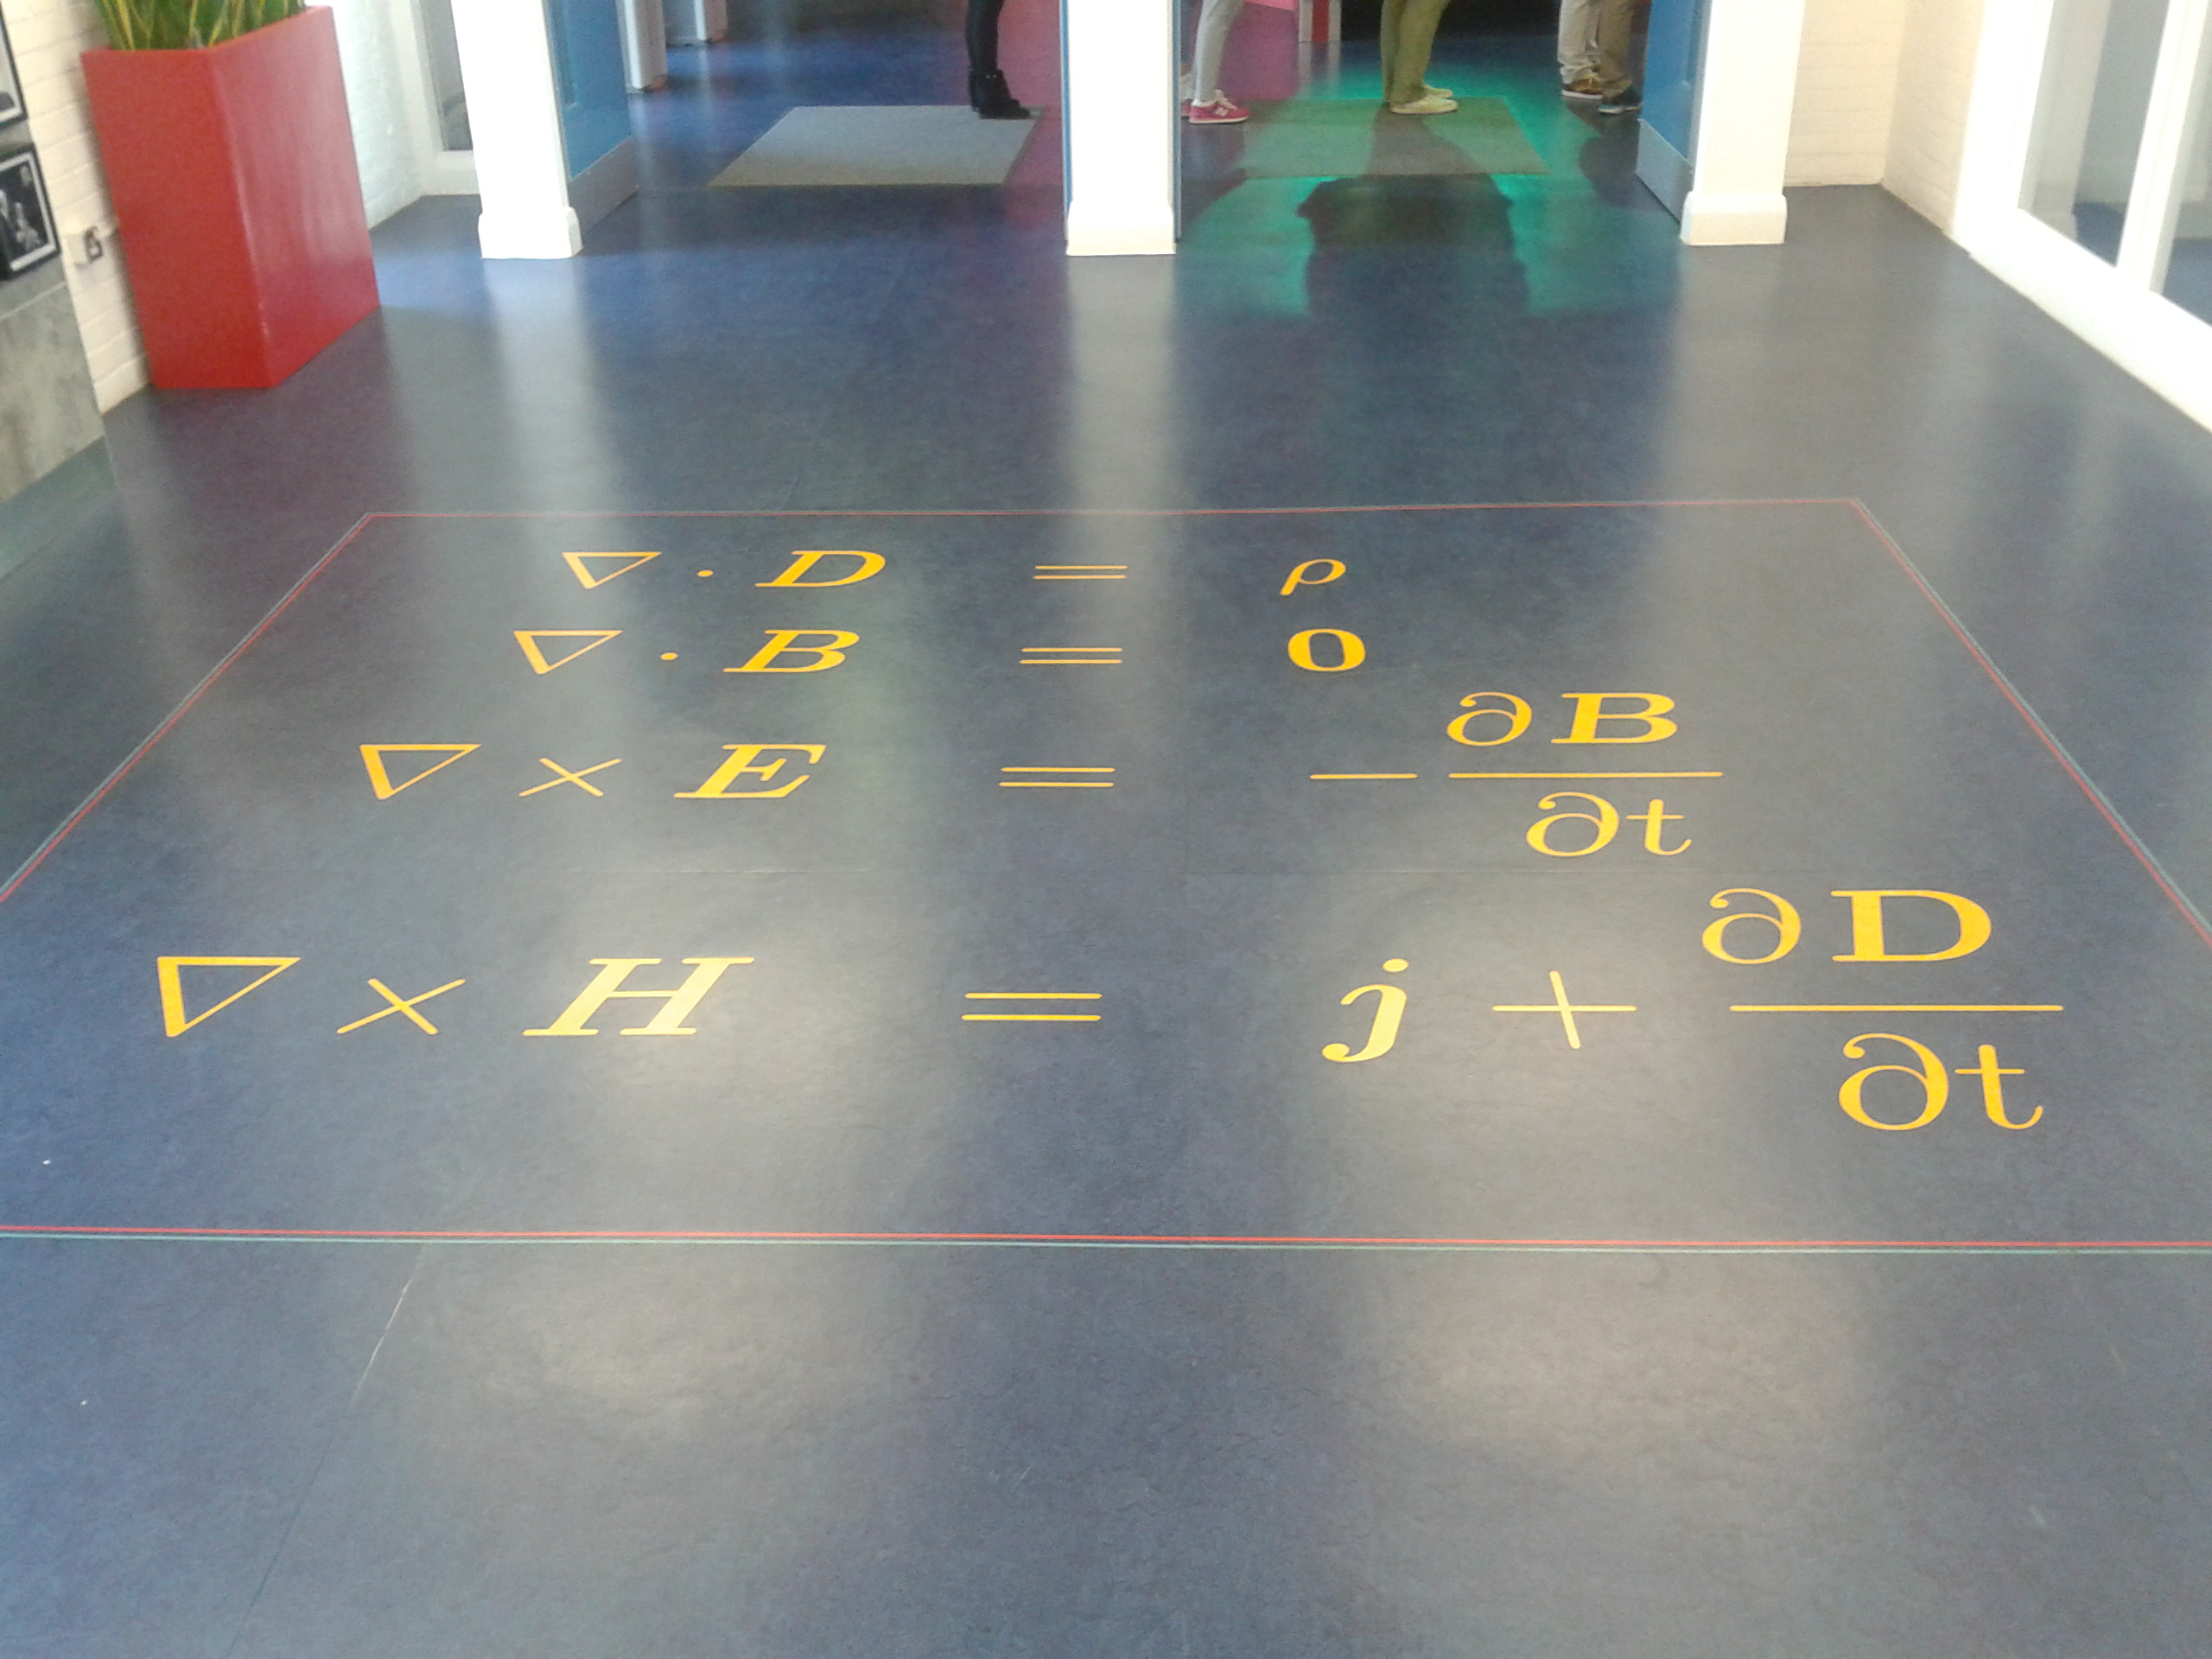
James Clerk Maxwell (1831-1879) was a Scottish theoretical physicist. His most prominent achievement was the formulation of a set of equations over which we walked in the hallway of James Clerk Maxwell building at EPCC supercomputing centre (University of Edinburgh).
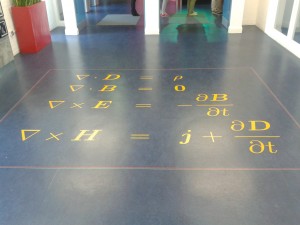
Maxwell’s equations in James Clerk Maxwell building
His theory of classical electromagnetism demonstrates that electricity, magnetism and light are all manifestations of the same phenomenon: the electromagnetic field. Maxwell is not known for visualization yet he has been said to be the first to use 3D visualization with clay for his famous formulas [1]. In the building named after him, we had a one-day training in 3D Scientific Visualization. What a coincidence!
We have learned that 3D visualization is not about colors for directors (CFD) but to have insight. That is what Maxwell did with clay and what we do nowadays with 3D visualization with computers.
I will be continuing my studies in computing under an Erasmus programme at the University of Edinburgh next year. Besides, I am deeply involved in 3D visualization under the SoHPC programme too. In my project I will add a functionality to a custom database reader plugin for VisIt. So, I guess, I’ve been called to write a few words on what I’ve learned about 3D Scientific Visualization so far.
The last day of the training week was about visualization. Besides general introduction, we received a hands-on training on ParaView and VisIt, the two most popular tools of the trade. The latter will be my companion for the summer.
VisIt is an interactive visualization tool used for graphical analysis of scientific data. It is a client-server application: the client sends the commands for visualization to the server, which computes the data using high-performance parallel resources to generate the visualization that is shown in the client’s display. Thanks to this operation, it can handle very large data set sizes in the terascale range. For this reason, VisIt is ideal for visualizing complex simulations such as the ones of the tokamak fusion reactor, which is precisely the one I am going to work with. It is also possible to run it on your own computer with small data sets in the kilobyte range.

Image generated with VisIt
This image was generated with VisIt following a hands-on tutorial used in the training week. I did it again with the purpose of showing which kind of visualization can be done with VisIt.
VisIt’s paradigm is to create one or more plots in a visualization window. If there is more than one visible plot at the same time, they are combined. It is possible to apply operators to the variables used to create the plots. One example of an operator could be the Slice: if you have a 3D plot you can “cut” a slice of it and just show that slice. In that case, it will use a portion of the data to create the plot.
In the next post I will be explaining what I have learned of XML and XSLT and how my work is related to them!
A bit of humor for my first post in shape of a song.
[1] West, Thomas G., ‘Images and reversals: James Clerk Maxwell, working in wet clay, in ACM SIGGRAPH Computer Graphics, Vol 33, Issue 1, pp 15-17, Feb 1999 [available online at: http://dl.acm.org/citation.cfm?doid=563666.563671 last accessed 30/07/2013]
*The title of this post is borrowed from “Chaos: Making a New Science” written by James Gleick (1987), page 47.

“I didn’t know too much about 3D visualization, but after reading this I can’t say that anymore, thanks!”
Amazing. Great job
Interesting topic!
My dear Luna, your work is fantastic, I dont know enough english but is very easy to understand the topic of your investigation, and is very intresting too.
You will be a great computer scientific.
And in Buenos Aires you will show me your advance in 3D visualization.
A big kiss. Lau
This VisIt seems really cool. From your experience with it, how difficult would be to use it?
I can’t wait seeing your visualizations coming out of the fusion reactor.
Thank you for all the comments! I’m glad that it was easy to understand and still interesting!
arc46:
It is not really difficult. The GUI is quite intuitive and powerful once you have gone through the tutorial. I will publish in the next weeks another visualizations with data from a tokamak.