Plasmary, plasmary night
What is the best way to visualise a vector field?
In 2D, the answer is obviously field lines since they elegantly show both the direction and, by their proximity to one another, magnitude of the field. Since the lines never cross and you can always pick the appropriate number of lines for a particular plot, it’s very hard to make 2D field lines look overly busy or difficult to look at.
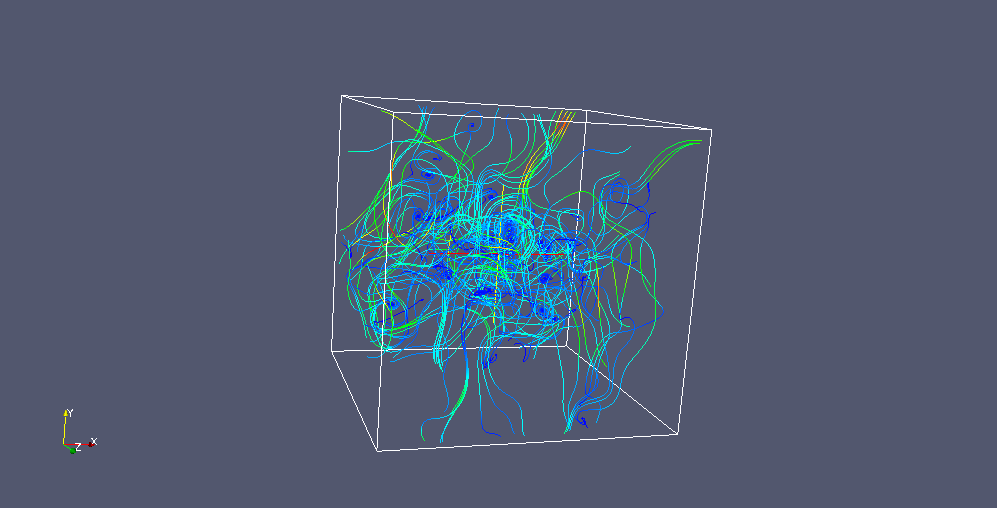
In 3D, the answer is not as obvious. Field lines are okay for reasonably uniform fields. The fact that you can look through the gaps in field lines and see more field lines completely ruins the relationship between proximity and magnitude but this can be made up for with colouring. With more complicated fields though, everything starts to look like linguini.
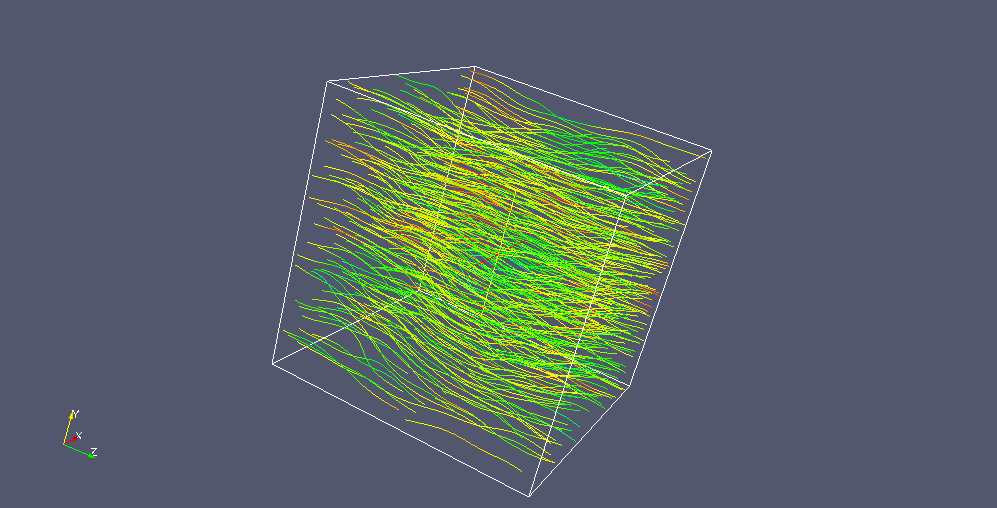
Magnetic field lines.
Field lines of the ExB field.
The prevailing idea at the start of the project was that each component of the field should be volume rendered. This is probably the simplest way to show all the information at once but it doesn’t show the direction of the field, which is often the most important aspect of a vector field, in a way that is at all intuitive. Personally, I think identifying a single point in space on three separate plots, using the colour of those points to determine the sign and magnitude of a vector component then somehow aggregating that information to find the direction in which the vector is pointing is more work than a human brain should ever have to do.
It would probably be better to use arrows…
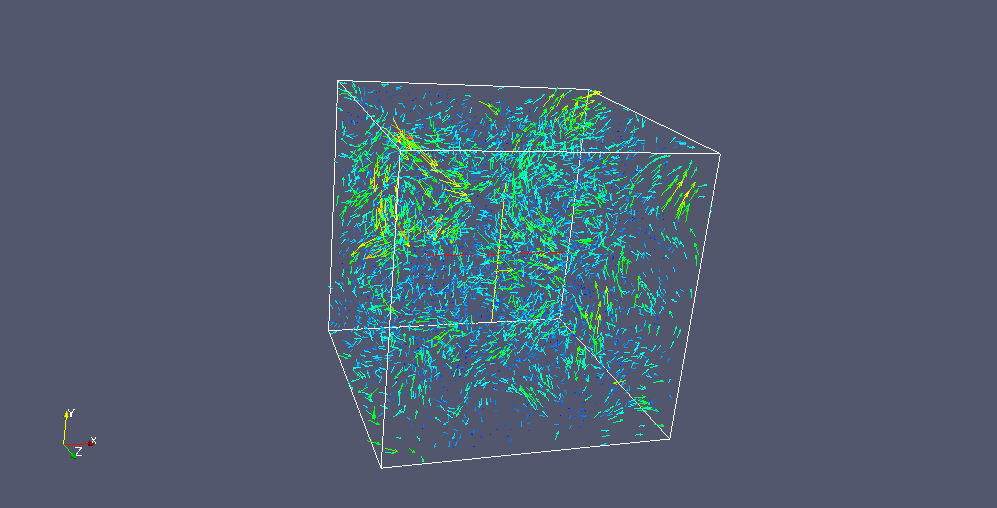
ExB field shown as arrows.
Plotting the field as an array of arrows is an improvement in that both the magnitude and direction of the field are represented simultaneously. It does, however, lack something that the field lines had, something that I now realise is important when representing vector fields. That is, the feeling that the field is a continuous topology – a single shape rather than a set of points.
After experimenting in paraview for a while, the solution turned out, as it often does, to be to add zeros to a few numbers, i.e. bigger arrows and more of them. The result is these rather pretty, almost impressionist, plots.
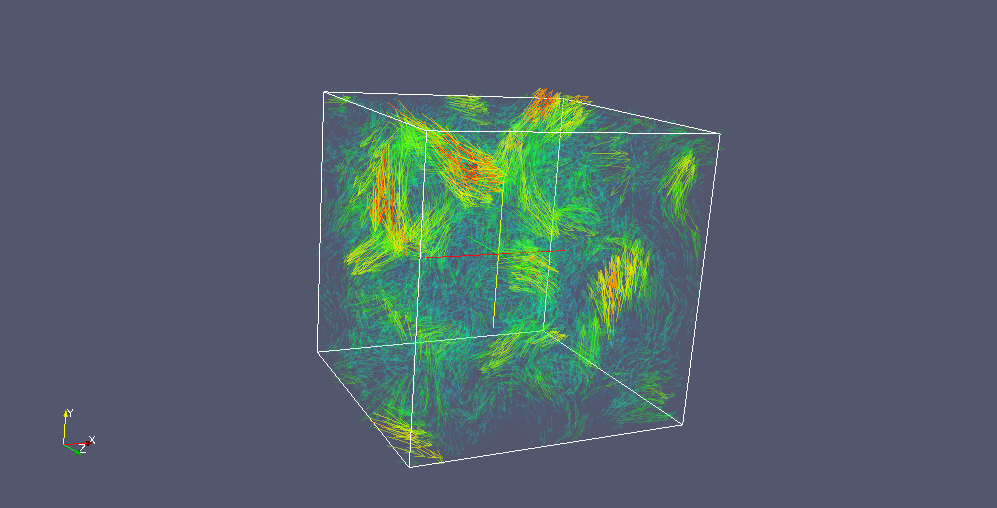
ExB field shown as larger arrows.
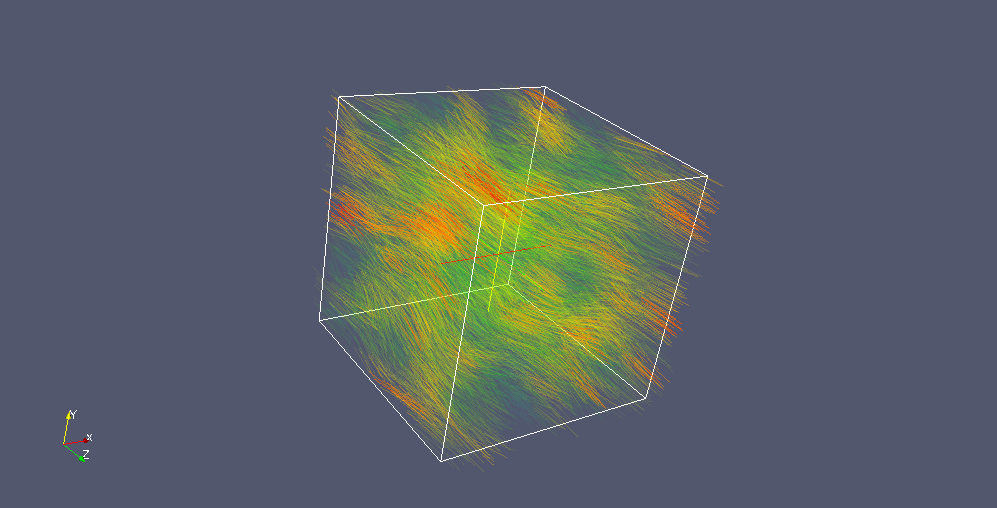
Magnetic field shown as dashes.
To me, this seems like a good way to succinctly show the important information about the field. Whether or not they’ll be useful in the final product, however, remains to be seen.

OOh eer… rather elegant-Looks good enough for a gallery. But what is a vector field?? Are you having fun? Clare has a new job in London. Kate has had a nose job and Grandma is recovering from pneumonia…never a dull moment.
Keep in touch
Love from
Your devoted mother.