R together ZeroMQ: and everything becomes possible!
Cork city could be very dangerous…Ondrej should know!
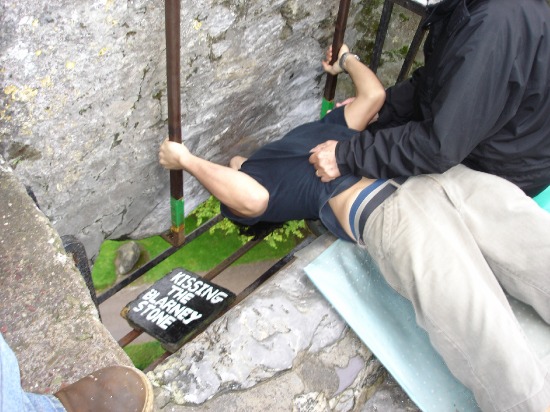
At the time of writing this post, I have now reached more than half of my summer experience given to me by the Summer of HPC. I can say that Ireland and its climate, a major concern for an Italian used to the heat of July and August, don’t scare me anymore: indeed it allows me to appreciate even more those few sunny days! In addition, thanks to an August Bank Holiday, Ondrej and I were able to visit Cork, Ireland’s second largest city by population composed mainly of university students, and Blarney Castle, a place nearby and which reserves a curious practice: in fact for the bravest it is possible to kiss a particular rock, called Blarney Stone, through a reckless method (as you can see in the image below!).
That’s one of the craziest thing that I have ever seen!
R logo.
Going back to serious stuff…I am pleased to present to you a programming language by the name very short but with very high potentiality: R! It’s a free software environment for statistical computing and graphics supported by a very energetic and active community; but why is this particular tool the one I picked? Initially my coordinator, Adam and I were oriented toward a different choice; but since R fits well with the project which uses ZeroMQ (I refer you to the link from my previous article for more information) and since it allows, with some open-source libraries that are well developed, getting the results via the more or less complex graphics statistical analysis easily, we didn’t think too much prior to in moving forward with our plan B for our SoHPC (in my honest opinion, the number one characteristic of good developers is: adapt to dynamic situations!).
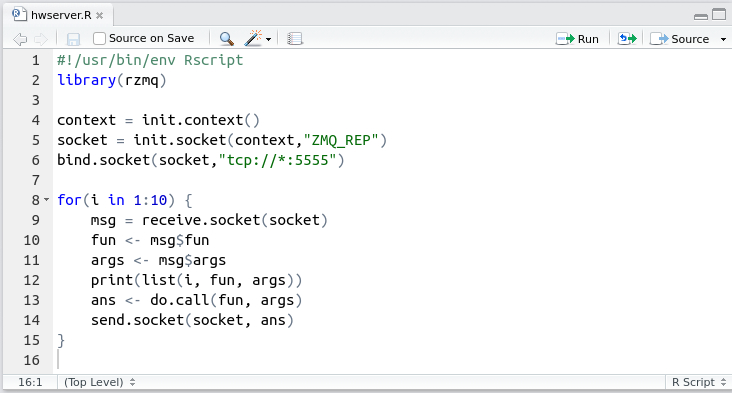
Example of Hello World Server developed in R using rzmq library.
Thanks to the open-source project created by the developer Whit Armstrong, called rzmq, we can in fact use a ready-to-use package in order to join the graphics capabilities of the R programming language with the ease of use of socket-like connections made available by ZeroMQ. On the style already analyzed in the previous article, we can study how these two tools work together: once the server is responsible for opening the connection (using a bind() function) with the Reply pattern, while the client connects with Request pattern (using a connect() function). At this point, the client sends the first message (in our example, the request to perform the square root of the specified number, 10000, using a send() function) and waits for a response from the server with the desired result (in our example, the value 100). The server receives (using a receive() function), immediately after printing some information (I refer to the image below for the analysis of the output of this simple example).

Example of Hello World Client developed in R using rzmq library.
For examples and for the development of my work I used RStudio, a powerful and productive user interface for R available for all popular operating systems and especially open-source. With all these information, we now have all the tools to finally reach the most interesting part of my project, which is the real-time visualization of what DL_POLY_4 processes: but given that this post would become too boring…I will see you again with another blog post for all this!
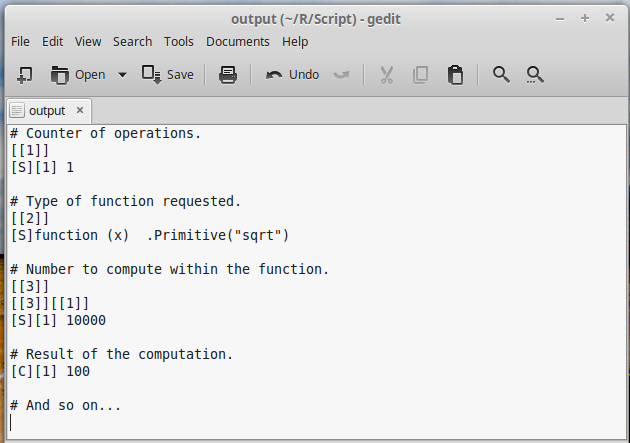
Formatted output produced by the Server-Client example explained over.
If reading this article has raised any question, I remain at your disposal through the platform of the comments provided below. Enjoy your summer!

Leave a Reply