The end, or just another beginning?

As summer ends, I can’t help but rememb Jim Morrison (The Doors) singing “this is the end, my only friend, the end…”. This post also represents an end. It is the end of my Summer of HPC project and hence the end of my stay in Bologna. Nonetheless, as Mike Oldfield puts it: “as we all know, endings are just beginnings…”. This post also represents a beginning. I will go back home and finish my Ph.D., making use of all the skills I’ve learned during this summer. Somewhere in Italy, someone will take the work I’ve done during summer, and continue the project.

Some of my best memories from Italy, the Duomo in Firenze.

Some of my best memories from Italy, the Ponte Vecchio in Firenze.
How to efficiently visualize data
On my first post, I explained what my task would be and in the second one how I could accomplish it. In this post, I will briefly present the results of my work. Have I succeeded? You can judge by yourselves…
ParaView Plugins
One of the reasons ParaView is such great software is its ability to grow. Users can easily program their filters to interact with the data and convert them in plugins by embedding them in xml files. The result would be a ParaView filter with a custom interface performing your operations!
So that’s what I did. I created plugins for interacting with OGSTM-BFM NetCDF output data as a time series, where the variables to present can be easily selected. Other plugins perform selections on the data set, e.g., selection of the sub basins in the Mediterranean Sea or selection between “coast” and “open sea”. Finally, some plugins perform post-processing of the data set, such as computation of the Okubo-Weiss criterion.
Pipes and pipelines
Paraview’s chain of operations, i.e., the operations performed on the data set is called a pipeline. Building a pipeline is necessary to perform a visualization of the data. They can be built interactively or by programming with Python. For a ParaView web application, the pipeline needs to be specified in Python in a script that loads the data set to the server. I built a couple of pipeline examples: one gathering the data from Pico and another from Marconi.
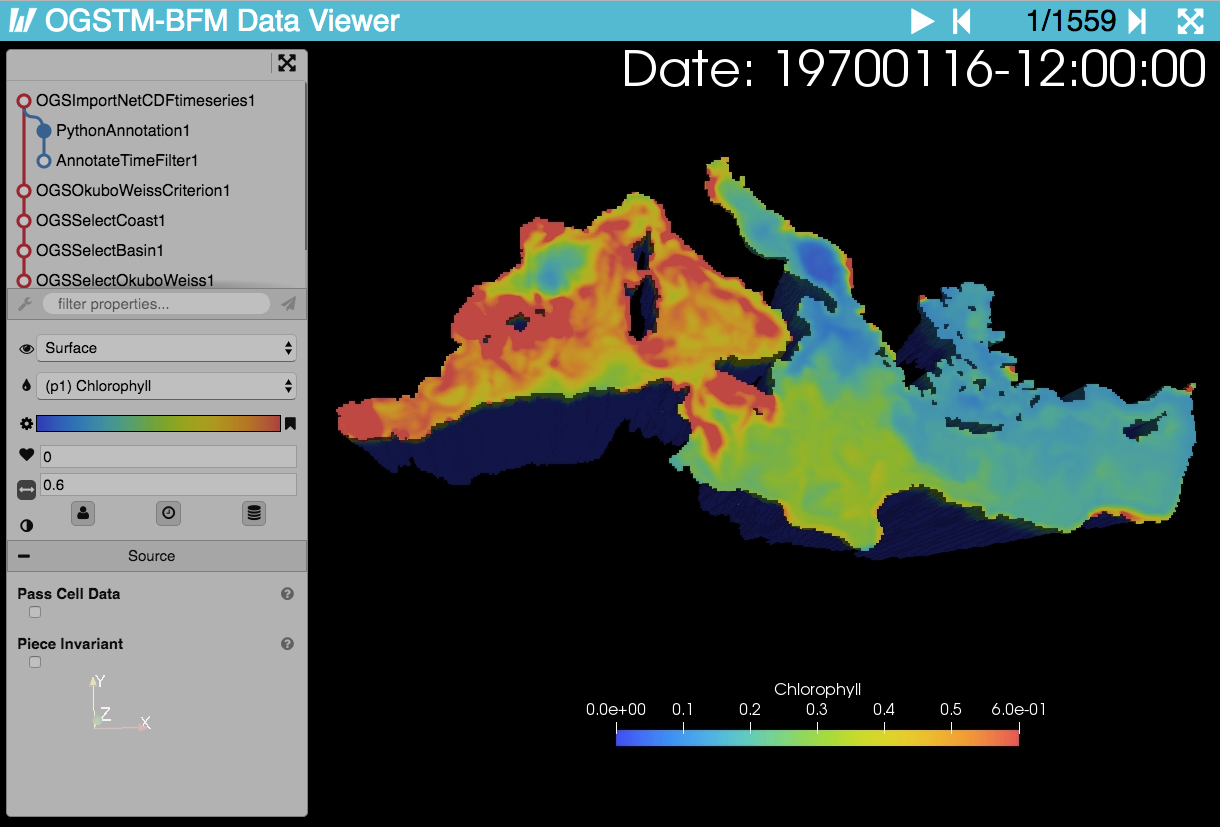
OGSTM-BFM Data Viewer with chlorophyll concentration (mg/m3).
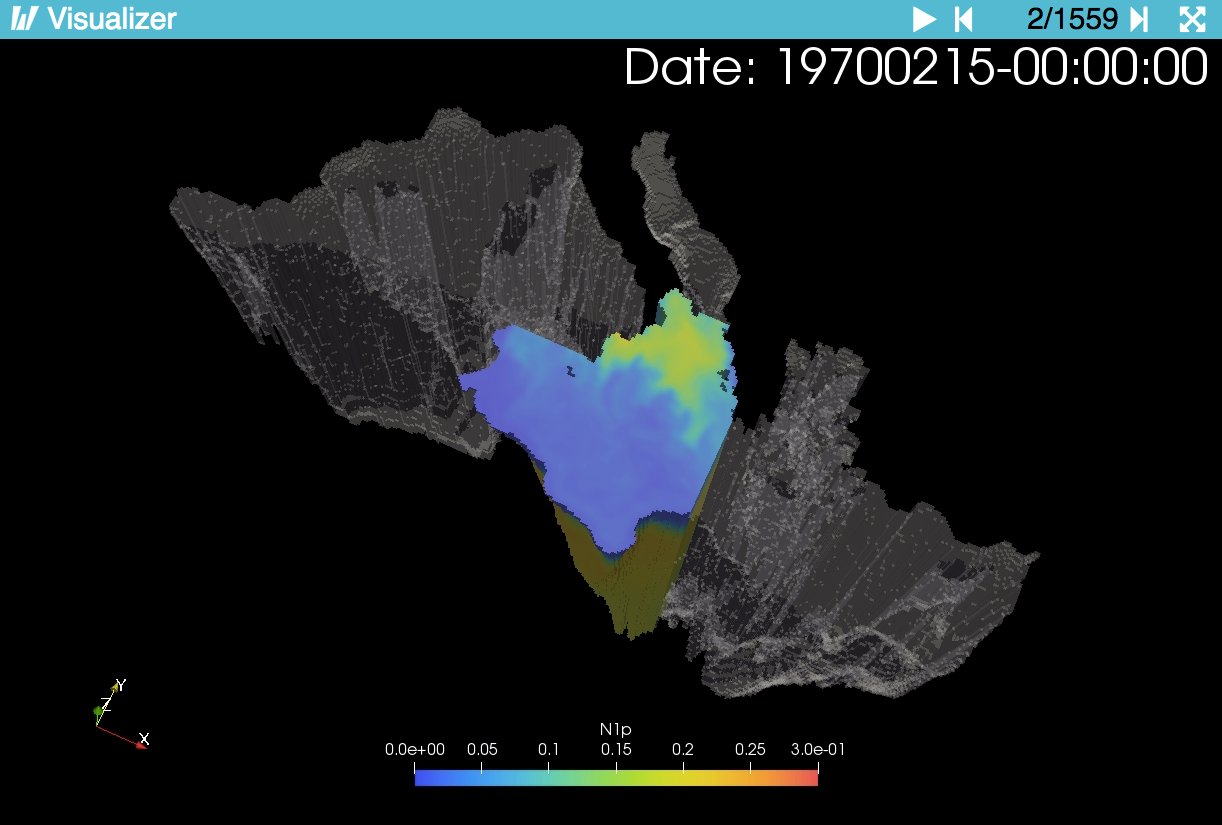
OGSTM-BFM Data Viewer with phosphates concentration (mmolP/m3) in the Ionian basin.
The OGSTM-BFM Viewer
“OGSTM-BFM Viewer” is the name of the web application I developed in this project. It is basically a fork of the Visualizer application from Kitware, where some of the features have been simplified or tailored according to OGS’s needs. In a nutshell, OGSTM-BFM Viewer loads all the OGS custom plugins and a pipeline. The viewer lets the user modify the properties of the filters that affect the visualization but not the pipeline.
Visit to my supervisors at OGS Trieste.
What lies ahead
As I am writing this post, the application has to still be deployed on the cluster. Once it is done, OGS will have an efficient viewer of data sets produced by OGSTM-BFM that can be easily accessed from a regular browser. The project will be continued by students at OGS and upgraded with the latest features that are currently being developed.
Quan l’estiu s’acaba i s’acosta anar a currar, Granollers fa festa i no pensa en l’endemà…
I’d like to end this post by mentioning the festival of my hometown: Granollers. It is in the last week of August, when summer ends and work starts (as the lines of the title say). This year I’m missing most of it but soon enough I’ll be jumping under the correfoc and of course taking pictures of everything! So, stay in touch with me, check out the photos and…

Because we love fire! Photo of a correfoc in Granollers last year.
See you around Europe!

Leave a Reply