The power of Big-Data

Do we really care about the cause ?
Big-Data are well into our everyday lives. They change the way we think, act and perceive the world. In the past, humans were trying to explain phenomena by struggling to find causality links between them. This was mainly due to the lack of data about the world around us. We relied on small datasets trying to generalize them by applying some laws we created, probably at our convenience. Nowadays things have changed however. There is a huge amount of data available, data that describe every aspect of our lives and the world we live in. By examining them we can draw important conclusions, without even caring for the causes. We can find out what happens, or is about to happen without caring about why this happens.
An example is the field of weather and climate forecasting. We have so many data available that we can predict future changes only by analyzing them. The best way to “look” at the data is through visualizations. And as the amount of data is huge and is growing everyday, the use of High Performance Computing resources is inevitable.
Exploring the Oceans..
You may be wondering what all of these have to do with my project. Part of my project was to visualize a phenomenon happening in the ocean. Two of the most important variables measured in the ocean waters are temperature and salinity. Understanding the correlation between the two would be very useful for the scientists. There is no direct relationship between them however. One could think that in warm places, water is evaporated, leaving high salinity behind. However this is not always the case. For example at the ocean surface near the equator the water is warm. There is also a lot of convergence of rain so the water at the equator is also fresh. But as you go deeper, the temperature drops and salinity increases so that water is cool and salty. At high pressure ridges where it rains little, evaporation leaves the salt behind creating warm-salty water. And at Polar Regions its even cooler. Finally, at places where large rivers flow into the ocean you can have warm fresh water . What is sure to be happening is that bodies of water with high salinity tend to sink down towards the ocean floor, and get replaced by cold water from the bottoms, thus affecting the surface temperatures.
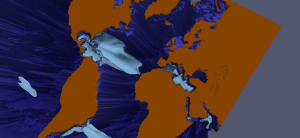
The following visualization was created using ParaView. I had a dataset containing the ocean depth available, so I used it as topography for my 3D object. On top of it, I displayed isosurfaces of high levels of salinity (PSU is the common measurement unit for salinity. It stands for “Practical Salinity Unit” and is actually dimensionless. Common values are between 30 and 35.) included in another dataset. By representing these surfaces over different timesteps I created an animation showing the movement of these water bodies.
What I was explaining at the beginning, was that we don’t have to make all these speculations and try to find the causality links between such phenomena. We have such a huge amount of data available that we just have to “look” at them. For this example, we could visualize the movement of the high-salinity bodies of water and see how this affects the temperature. So, we might never find out why exactly this happens, but we can get the results we need without theories and long mathematical equations.

