The triple P conundrum

Pasta, pizza and ParaView are the topics I want to talk about in this post. As a Catalan guy, I’m used to the Mediterranean diet and it is impossible for me not to talk about food when staying in Italy. Of course, I would like to add the fourth P here: paella. But let’s stop daydreaming and get back to business!
Pasta, pizza and more
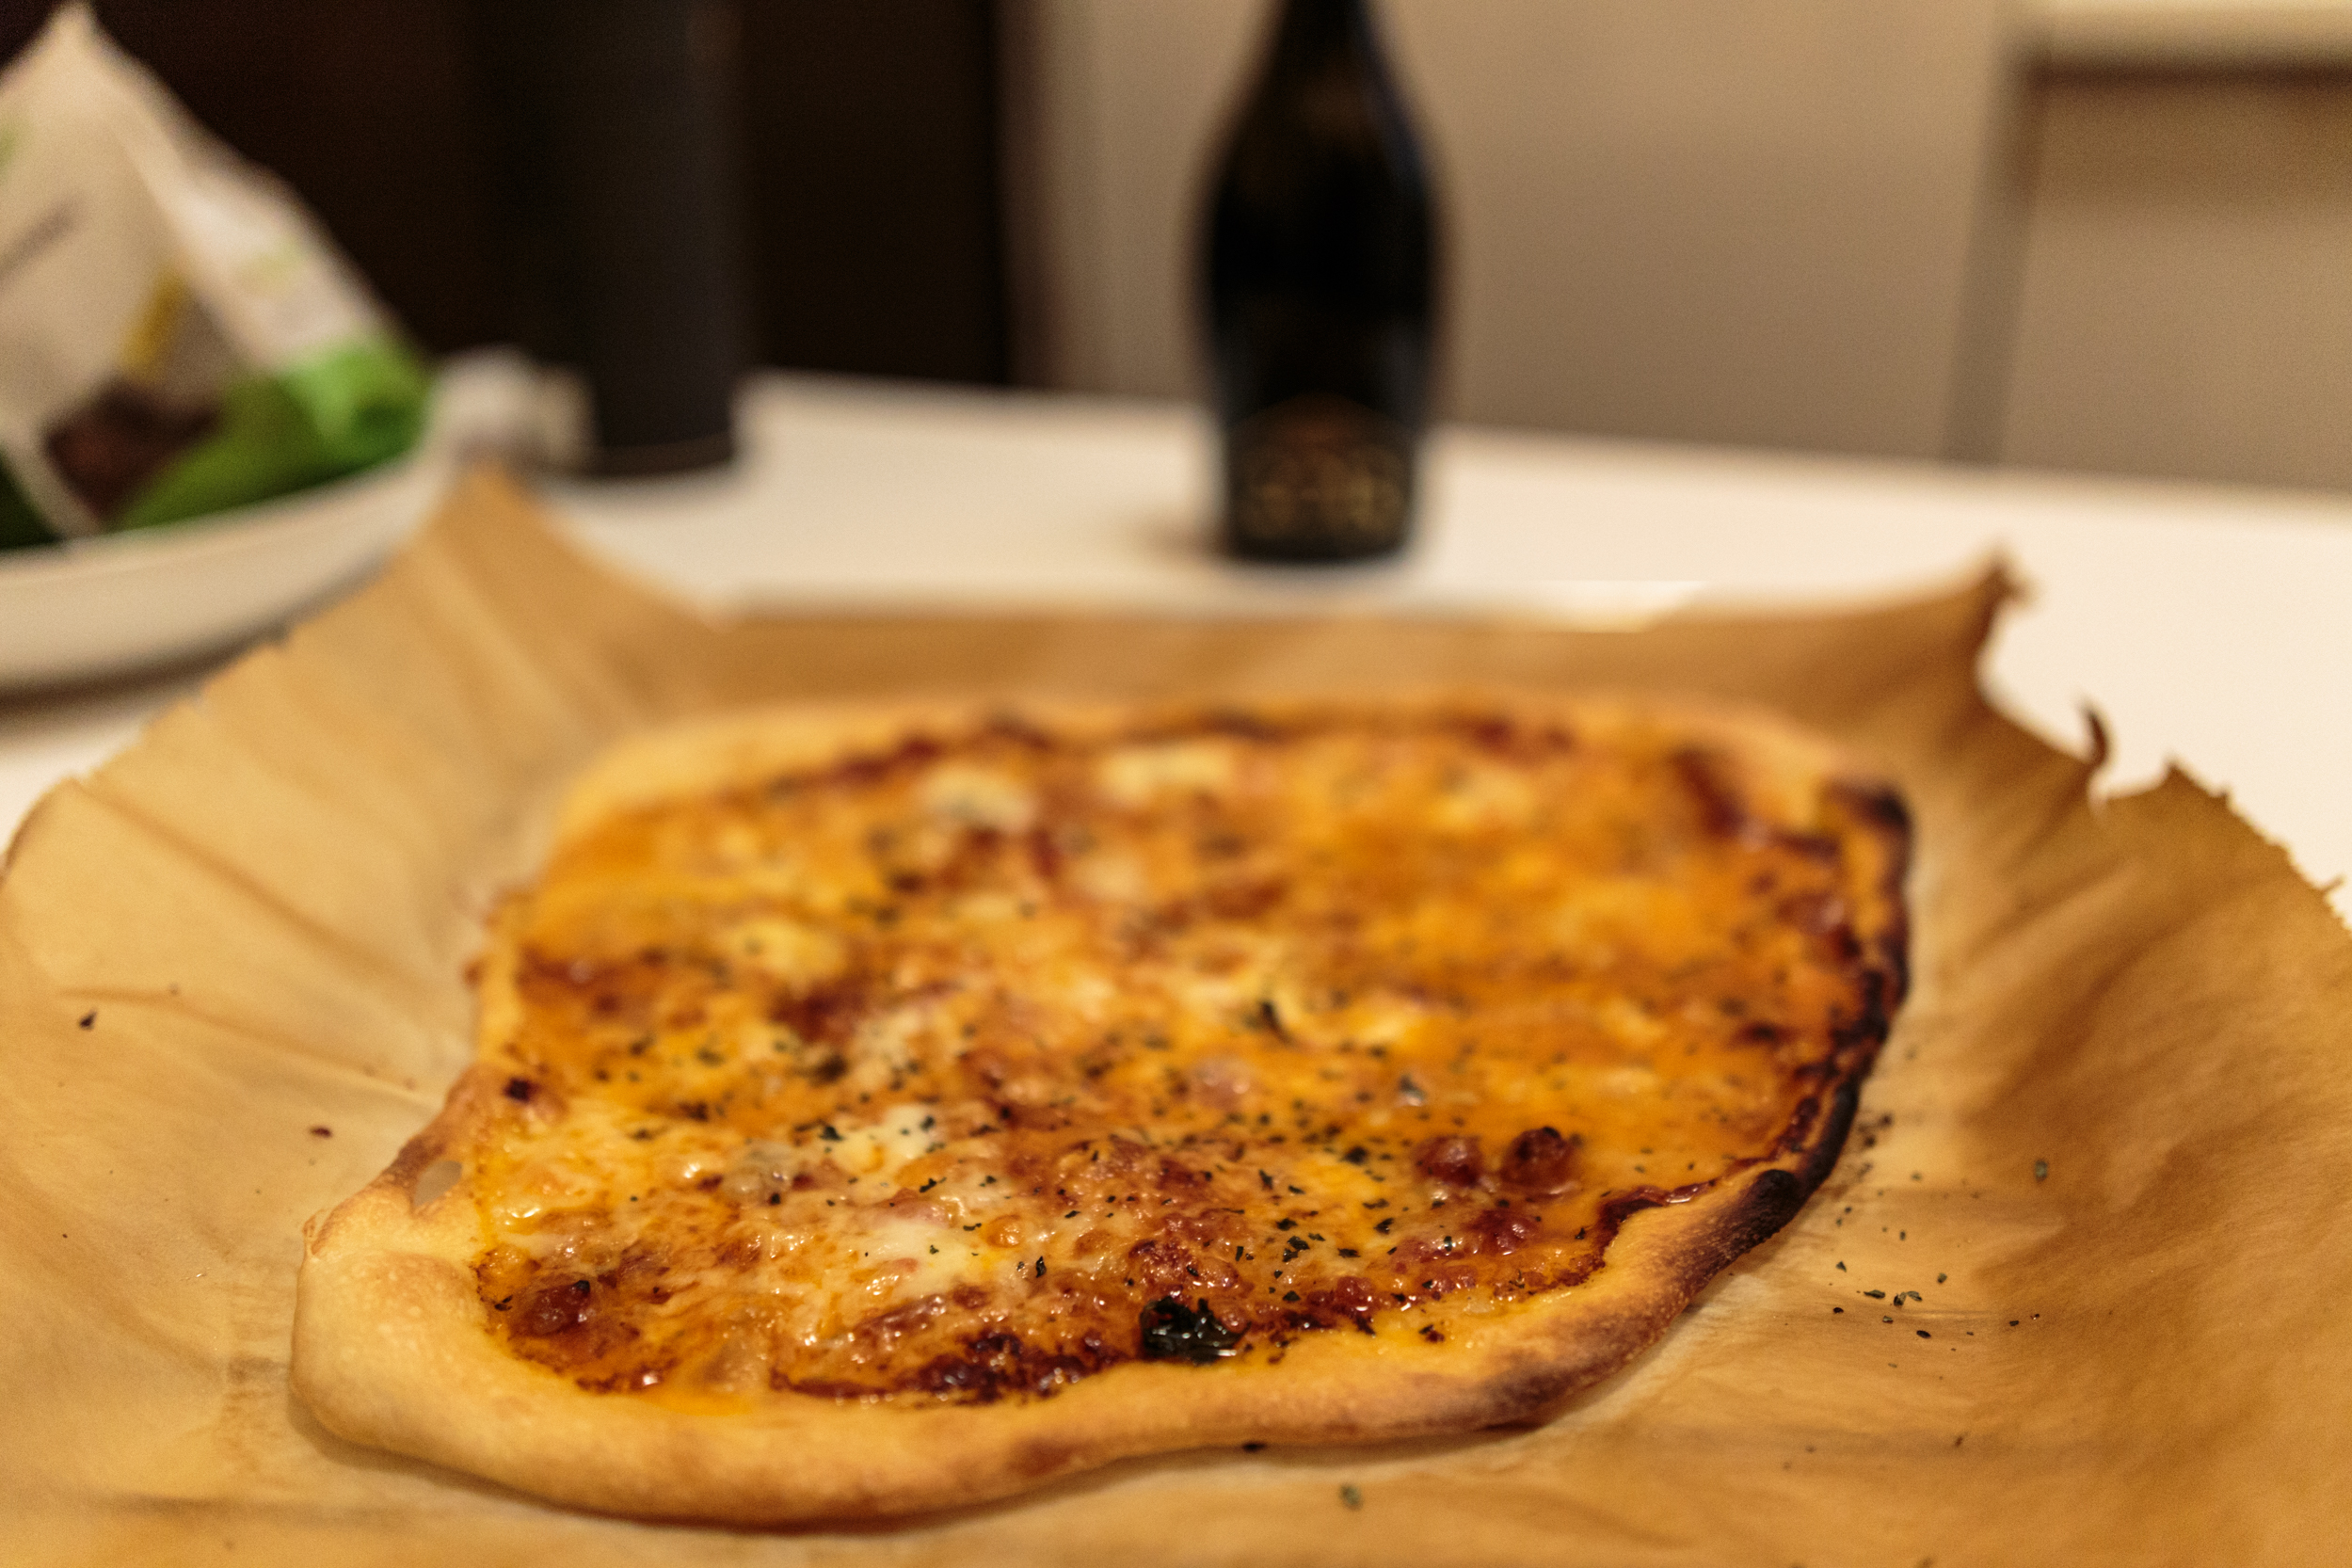
The homemade pizza made using ingredients from Parma.
Italians say that you cannot get fat from pasta and pizza if they are properly made. And in order to do that one must visit the city of Parma, home of the famous parmigiano cheese and prosciutto di Parma, which were bought in abundant quantities. Guess what you can do with all this food: a homemade pizza (and probably the best pizza ever so far)! The outcome? Well, you can guess what happens when top Italian ingredients are mixed. Magic happens! I also visited the beautiful city of Venice (click on the names of the cities to check the photo album).
ParaViewWeb
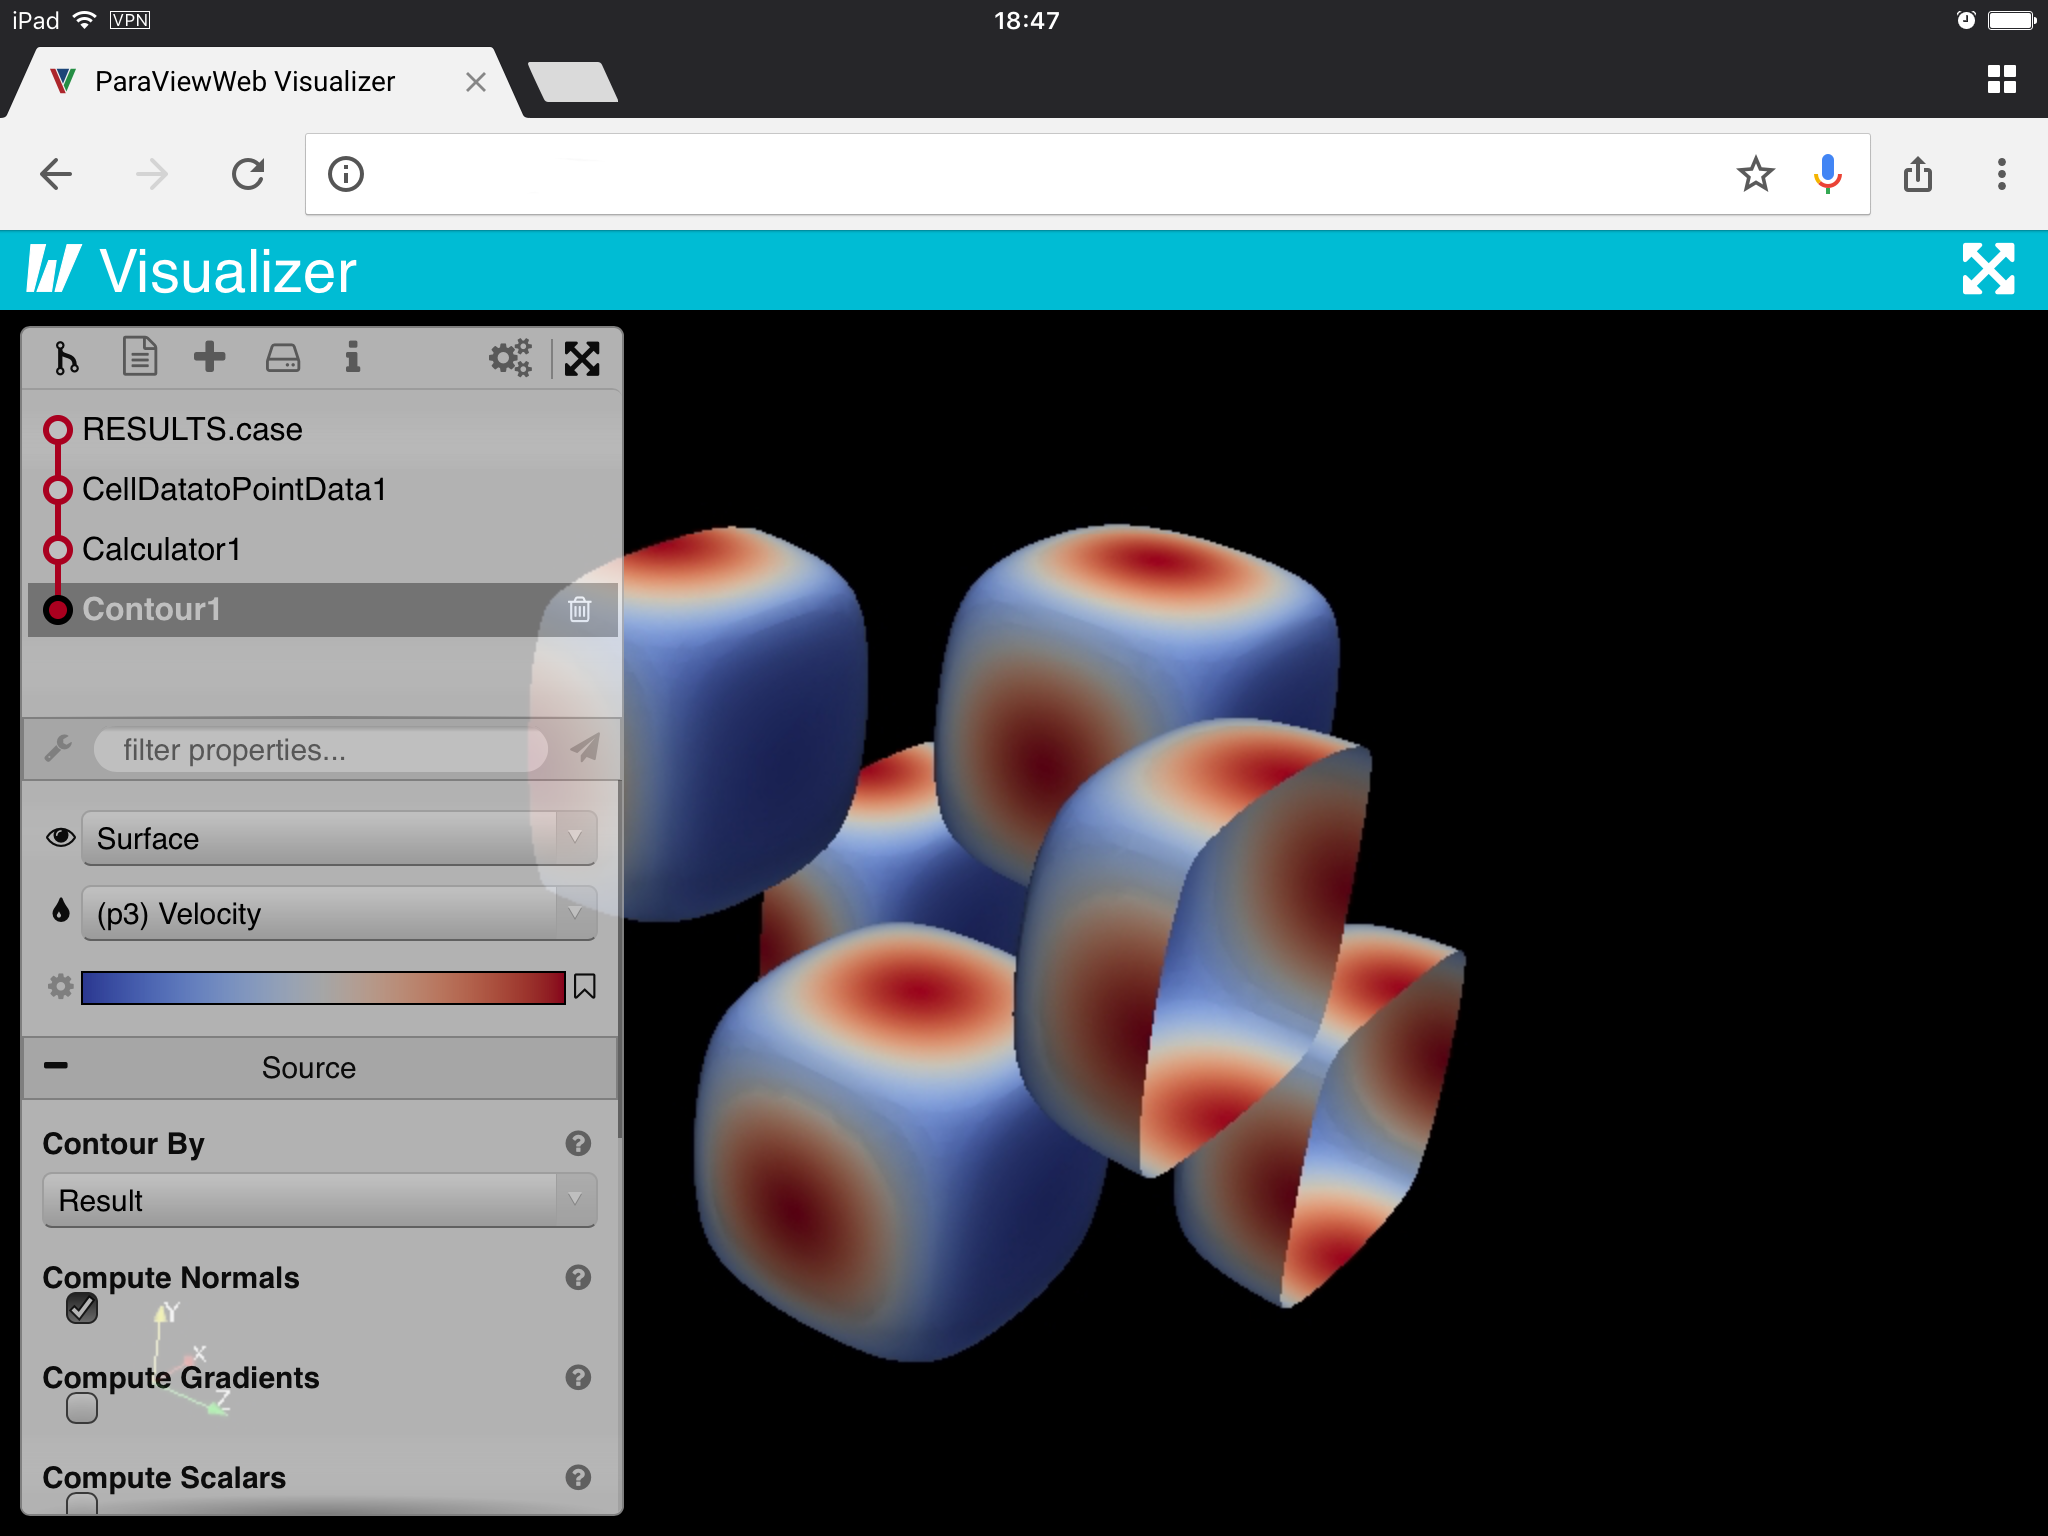
Demo of ParaViewWeb application “Visualizer” on an iPad.
Now, let’s stop the food talk for a moment. In my previous post, I explained that a simple and efficient way to visualize scientific data can be to simply have it displayed in a web browser. Well, that’s exactly what ParaViewWeb API is for. ParaViewWeb is a set of tools to build a web application where the data can be loaded, visualized and it also allows you to interact with the data..
How does it work?
Let us imagine a customer enters a restaurant. The client looks at the menu and asks: “I want the pizza ‘chlorophyll concentration on the Mediterranean Sea’” to the waiter. The waiter replies: “very good choice sir” and goes into the kitchen to tell the chef what the customer wants. The chef prepares the meal and gives it to the waiter and the waiter serves it to the customer. Finally, the customer gets what he has asked for on the table. Here, the customer is the client, the waiter is host 1 and the chef is host 2.
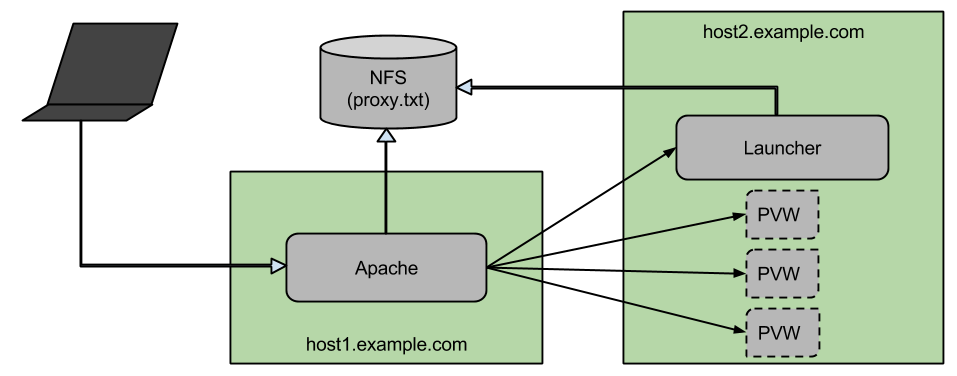
Representation of ParaViewWeb 2 hosts deployment. Extracted from the ParaViewWeb documentation.
Using this example, I will explain the problems I have to deal with, if I want my “restaurant” (or web application) to work properly:
- Customers generally don’t want to wait (or wait as little as possible), so the waiter must be fast in delivering the visualization to the client.
- Waiters need to remember what each customer wants and not mix up or forget their deliveries.
- The chef must be efficient in preparing the data. Here, ParaView Python is the one dealing with getting, loading and pre-processing the data, before it is given to the customer.
- As in every restaurant, the customer needs to stick with what is on the menu, i.e., the available apps. Variations to the menu might be easily done but changes can take more time.
What have I done so far and what I will be doing
During this past weeks I’ve been setting up the “restaurant”, i.e., I have set up my host 1 using Apache2. For now, my host 2 is the same as my host 1, however, PICO will be used as host 2 in the final implementation of my application. In the coming three weeks, I will be developing the “menu”, i.e., the web application to visualize the data-sets from OGS.
A visit from OGS
I cannot end this post without talking about a short visit I received from OGS. Cosimo Livi, who is doing his master thesis in OGS, came to CINECA as he is currently involved in data post-processing using ParaView. Together, we worked to develop a methodology to efficiently convert the data-sets from NetCDF to VTK for ParaView.
Cosimo Livi from OGS and me during his visit at CINECA last week.

Leave a Reply