What’s in a virtual screening dataset?

In my previous blogpost, I explained the main objectives of my project. During these weeks, I have focused towards the data analysis side of HPC rather than working on optimizing a program that runs on a super computer. I have been working to add the re-ranking functionality to ChemBioServer, which uses R scripts as a back-end to do some basic filtering on docking results. As it turns out, I haven’t actually had to interact with any of the preexisting codebase for the server – so I chose the reptile in the on-going R vs. Python war. In case you’re out of the loop, Python is a really sweet programming language for a scientist like me who is just starting to walk his first steps in serious software development: it’s fast to prototype and test new ideas on, and has a very rich ecosystem for all things data science.
In order to start getting my hands dirty, I was given a dataset of binding affinities of around 25k different compounds to 7 kinase structures: 2 ALK5 crystals, 3 ALK2 crystals, 1 P38 crystal and 1 ALK1 crystal. If this sounds like mumbo jumbo to you, don’t worry: it just means that for some of the kinases we have more than one experimental structure available, so we can make use of it as we would like our drug to bind with a strong affinity to our protein regardless of its shape, in general terms.

Look at the H atoms go! Protons readily relocate in some organic compounds, giving the illusion that the two molecules shown here are different. This is the most typical case of tautomerization.
The first problem I faced when analyzing these results is one which is all too common for chemists: the nomenclature of organic compounds follows a certain set of rules (that’s right, it’s got 1300 pages) that explains what the molecule is like, but still it can hide a lot of information about it from us. As a side note, I will say that this nomenclature can be absolutely hideous when molecules are big, and you don’t often hear things like this on chemistry laboratories: “Hey Johnny, do you still have some of that (2α,4α,5β,7β,10β,13α)-4,10-Bis(acetyloxy)-13-{[(2R,3S)-3-(benzoylamino)-2-hydroxy-3-phenylpropanoyl]oxy}-1,7-dihydroxy-9-oxo-5,20-epoxytax-11-en-2-yl benzoate we synthesized last week? “, so I kind of dispute it’s utility on everyday life situations (yes, nomenclature exams leave a scar on the minds of many chemists and I’m still sore about it three years after). But I’m digressing. The issue is that the classical two-dimensional drawings of molecules that you might be familiar with are a simplification of their reality. In a docking dataset, there might be several repeated entries of the same molecule. Or is it really? See, the thing is that a given molecule can have multiple stereoisomers or tautomerization states, which we want to account for during our docking calculations. So they have to be added in as separate entities even when they are not. The good news is that I’m not the first one to have come across these issues, and there now is a widely used notation to accurately describe the state of a molecule with an ASCII string. So after having parsed all the entries of the docking dataset to their ASCII representation, many of these ‘repeated’ entries in the dataset were gone.
Finally, I’ll give an overview of how the ALK2 dataset looks like by loading the results, cleaning the data and visualizing it using the wonderful Pandas library. The image below is a square symmetric representation of the binding affinities of ~25k molecules for the three ALK2 structures. We can quickly see that there is a normal distribution of the compounds for each structure, and that the 3H9R crystal has higher affinities for the compounds in general. But what is interesting is that there’s a degree of correlation which we would expect: compounds that bind tightly to ALK2 generally do so regardless of the crystal. You’ll get a better intuition of this using this interactive 3D representation. The blue line on each scatter graph is a simple linear model built by randomly splitting the data into train and test datasets, and hence you can see a small difference in the reported Variance Score for the 3Q4U-3H9R scatter plots. Now that we have a sense for what these docking results look like, we’ll explore in the next blog post how the re-ranking algorithm has played out.
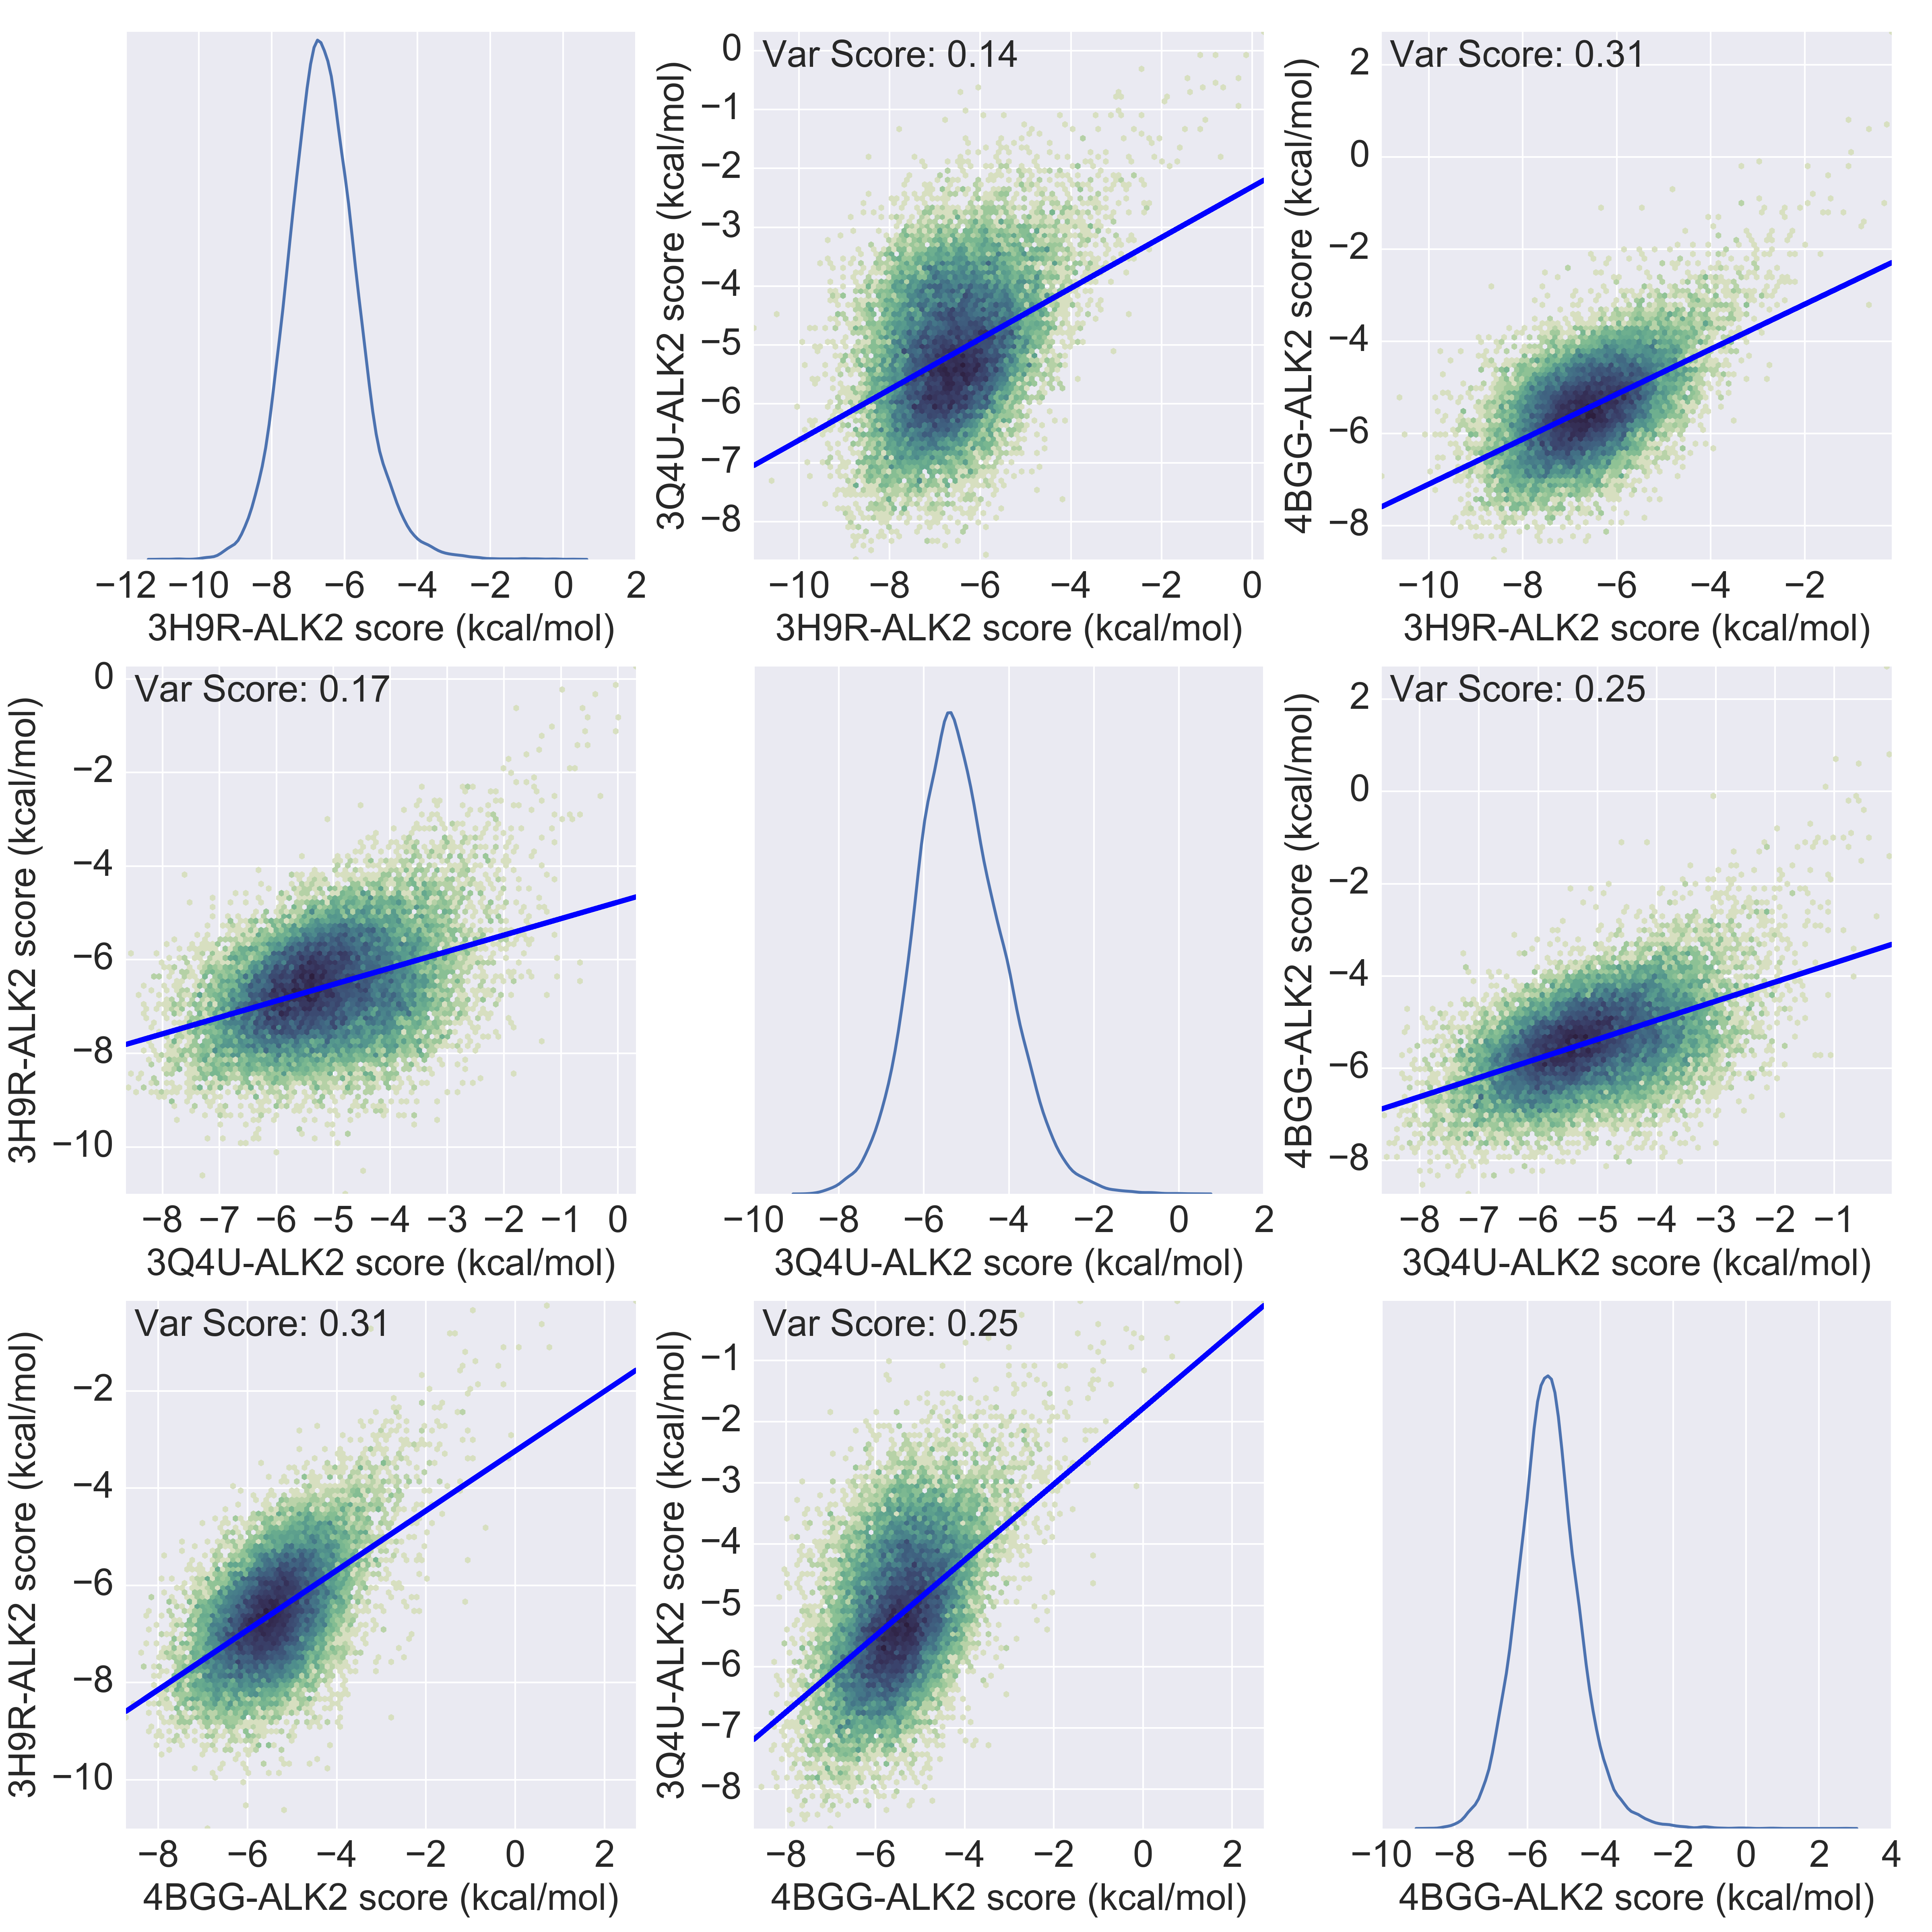
Overview of a virtual screening experiment of ~25000 compounds on three crystals of the ALK2 kinase. The 4 digits preceding the -ALK2 are the corresponding PDB entries of each crystal. Click here to interactively explore this dataset.

GREAT JOB!!
Good job! I really like it!
Well done
By the way, do you still have some of that (2α,4α,5β,7β,10β,13α)-4,10-Bis(acetyloxy)-13-{[(2R,3S)-3-(benzoylamino)-2-hydroxy-3-phenylpropanoyl]oxy}-1,7-dihydroxy-9-oxo-5,20-epoxytax-11-en-2-yl benzoate we synthesized last week?
I might need it for my next sythesis 😉
Samantha don’t lie you’re not a synthetic chemist. You ain’t fooling nobody.