Collect-Organise-Visualise: A Visualisation Dashboard for Fostering the Exploration of Climate Data

Visualisation is realising a growing recognition as a pivotal part of the data analysis process. As the title suggests, the project aims to avail data visualisation to help the climate research community answer or discover interesting questions about the field. The project particularly adopts interactive visualisations in order to adequately explore and communicate the understanding of large-scale climate datasets.
Data visualisation can be ideally described as the transformation of the symbolic into the geometric. Various benefits can be gained through data visualisations. The pictorial representation of data can help answer or discover further questions. The usefulness of exploratory data analysis using visual techniques was early introduced in John Tukey’s landmark textbook Exploratory Data Analysis.
However, visualisation has gained particular significance in the wake of Big Data analytics. Exploratory visualisations have become an imperative tool which allows us to discover and summarise the main characteristics of such large-scale datasets. In our case, the project deals with large-scale datasets of climate research. The data were formerly produced by climate simulation models using the WRF software.
We mainly aim to build a dashboard that can foster climate research in a twofold aspect. First, the dashboard can be used to facilitate the organisation and indexing of climate data. As climate simulation models produce huge amounts of data, it is necessary to automate the process of archiving and indexing of data and metadata as well. Second, the dashboard is intended to provide interactive data visualisations. The visualisations are intended to be produced in a web-based format, which can be interactively explored through the web browser. To achieve this, we utilise Python along with the visualisation library Bokeh. The figure below provides an overview of the project development stages.
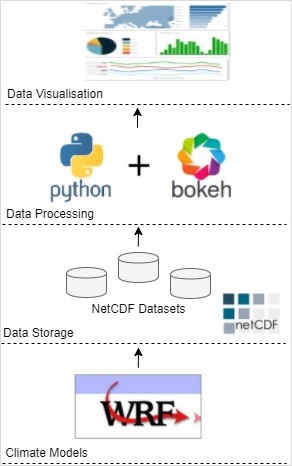
Figure: Project Overview.
