Dusting off some gold

Let’s go back, way back…
The year is 2014.
Pharrell Williams’ Happy is number 1 on the charts, and a former Etonian is Prime Minister of the UK.
The motivating paper for my project is released: Toward the efficient use of multiple explicitly managed memory subsystems.
Though it is a self-evident truth that all folk (and bytes) are created equal, it is also an empirical truth that bytes (and folk) have different needs and behaviours during their lifespan. Some bytes are always changing, others need to remain dormant but reliable for years at a time.
A simple memory model of how data is stored today in, for example, your laptop is a large hard disk for long term storage, a smaller main memory for programs and data you are using at the time, and a few layers of increasingly tiny cache for data being processed at that moment.
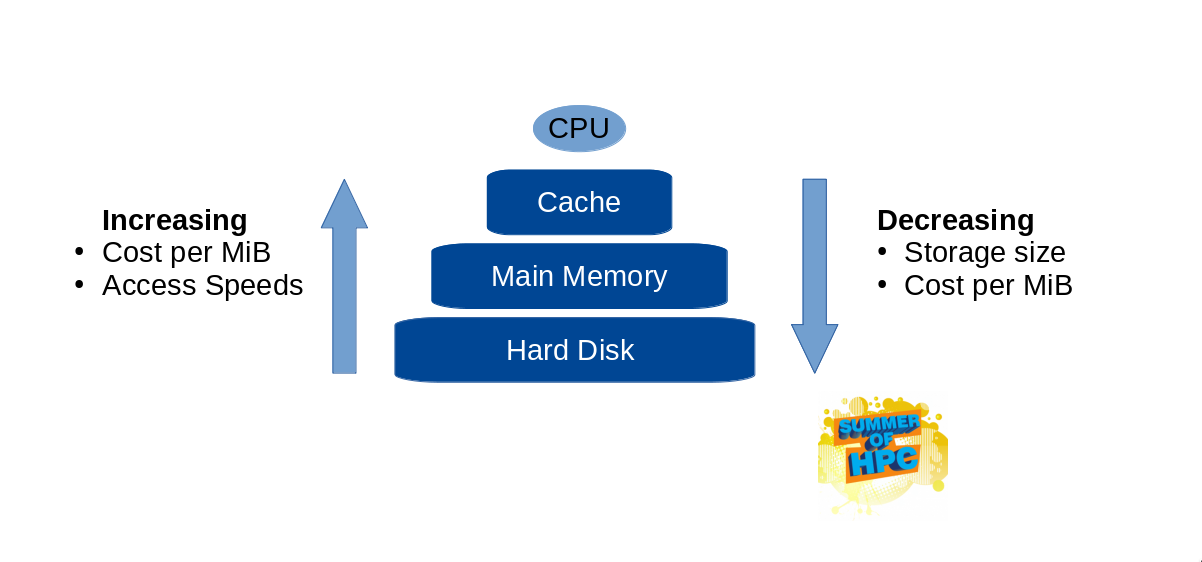
However, there are a number of budding memory technologies which do not fit neatly into the hierarchical model. They might have unique features, which means that the trade off is more complex than speed versus size/cost. This presents a great opportunity for HPC, since getting this balance right can save megabucks!
The work of my colleagues at the Barcelona Supercomputing centre provided a possible answer to the question: If one were to have a variety of memory technologies, with different properties and costs, how might one decide which memory subsystem to place the different data objects of an application in?
The approach they adopted was a profiling-feedback mechanism. By running workloads in a test environment, and measuring what data is accessed and how, one can devise a strategy of where that data can be placed in future application runs.
With this profiling data, it can be observed that variable A is read a million times, but only changes a few dozen. Or the very large array V is barely accessed at all. This insight into the application can then be used to guide a data placement strategy for subsequent runs of the program. One does not even need to really understand what the application is doing. Which is good for me, since one of the test workloads is a nuclear reactor simulator!
To perform this profiling, the team heavily adapted the Valgrind instrumentation framework, so that they could measure the access patterns for individual data objects in a running program. The fork, developed for a suite of papers from the BSC a number of years ago and described at length here is what I’ve spent the past two weeks getting familiar with.
Many will only know Valgrind as a way of detecting memory leaks in their software, but it also works well for profiling by including features such as a cache simulator. It was this part which was extended the most.
Now fast forward to the current year…
Remixes of Old Town Road fill the top 10 slots, and a former Etonian is Prime Minister of the UK.
Since then the Valgrind-based profiling tool from the BSC has remained mostly dormant. The boundless curiosity for research that formed it has not waned, only moved onto other things (you can find a wealth of tools they have released to the public over the years, available on their website here).
Thus the first part of my project is seeing if I can breathe life back into the tool, and reproduce the results of the motivating paper. After that, I will explore what 2019 magic I can bring to the table.
The process of reproducing the results is complicated somewhat by the tool behaving strangely in modern environments. With certain compiler versions, and experiment configurations, the tool gives strange results, and the few scraps of documentation must be read like poetry. The challenge can be compared to those that archaeologists may face, though for something that isn’t particularly old.
I have been bottling and distilling a little bit of the mid 10s in a Docker container. There are more blog posts about Docker than there are meaningful use-cases. Thus, I will give a short explanation using the externally useful shipping container metaphor.
Prior to the invention of the shipping container, it could take days to load and unload a ship. Everything came in boxes and barrels of different shapes. If you needed something climate controlled, you might need a whole ship just for that purpose. Apparently a family friend of mine used to work on a so-called “banana-boat”, which transported exactly what you think it did.
This was very inefficient.
Then, the shipping container comes along. Instead of trying to fit everything on the ship like a big game of Tetris, use a standard sized container, and put everything that the product needs to survive in the container too. Loading and unloading times go from days to hours, efficiency increases, waste decreases. Maybe not every container is filled to capacity, or you have two banana containers next to each other, with distinct cooling systems. But the benefits generally outweigh the costs.
Now, perhaps some citations are needed for that anecdote, given that my knowledge of marine commerce history is a tad rusty, but if you can apply the reasoning to software, then you’ll understand why Docker containers are useful for what I’m trying to do here. If the tool behaves in unexpected ways in modern machines, put it inside a container with toolchain versions from the time. The parameters of the container are defined in a simple text file, which will hopefully help guarantee reproducibility in future.
I am still trying to find the right conditions of the old experiments, and get the results. Once this is complete I will see if I can gradually reduce the dependencies of the tool, so it can be used elsewhere. I will start by telling it that Glen Campbell is dead, though I might hold off on mentioning Anthony Bourdain until after I’ve finished the project.

Leave a Reply