What secrets are hidden in the data? – Data Prep and Analysis

Welcome, all! I have been working on an Industrial electricity consumption prediction project. I have received this data from a Slovene company which sells electricity to its customers. The dataset is a 15 mins Electricity Consumption data spanning one year for 85 end-users. The company wants to build a forecasting system in order to make better spending forecasts from the consumer’s consumption history, thereby making it more accurate to know how much electricity should be bought for the selected time interval, which will ultimately make it more profitable. I am developing a system for profiling consumers and develop algorithms for predicting consumption, which will enable smart ordering and planning of energy consumption and thus great savings.
Exploratory Data Analysis
After the identification of data and their sources; I am investigating the influential external factors for the consumption of end-user electricity. The focus is on the calendar and the weather. For this, the consumption data is fused with data about influential external factors (both on 15 minutes scale) and I have firstly performed exploratory analysis trying to understand how the selected factors influence the energy consumption. I have downloaded the weather data from the Environmental Agency of the Republic of Slovenia (ARSO) website. The holidays in Slovenia information is obtained from the Time & Date Slovenia weblink. Then, I have derived the long holidays i.e. suppose Thursday is a holiday then it is highly likely that most of the people take Friday also as leave day, thus making it a long holiday. A similar case is for Tuesday. This holiday data and the derived information are then used to get insights from the clusters which are formed using unsupervised learning. Using this I have performed statistical analysis for every consumer.


The correlation of various weather factors with consumption.
Though, there are many consumers who don’t exhibit similar temperature vs consumption behavior.
Unsupervised Learning
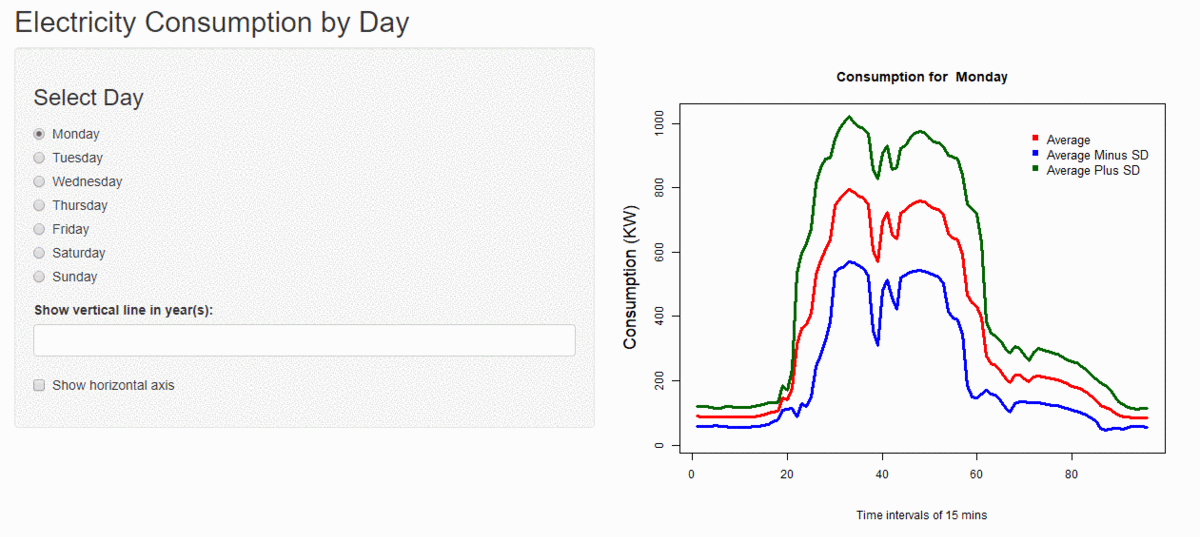
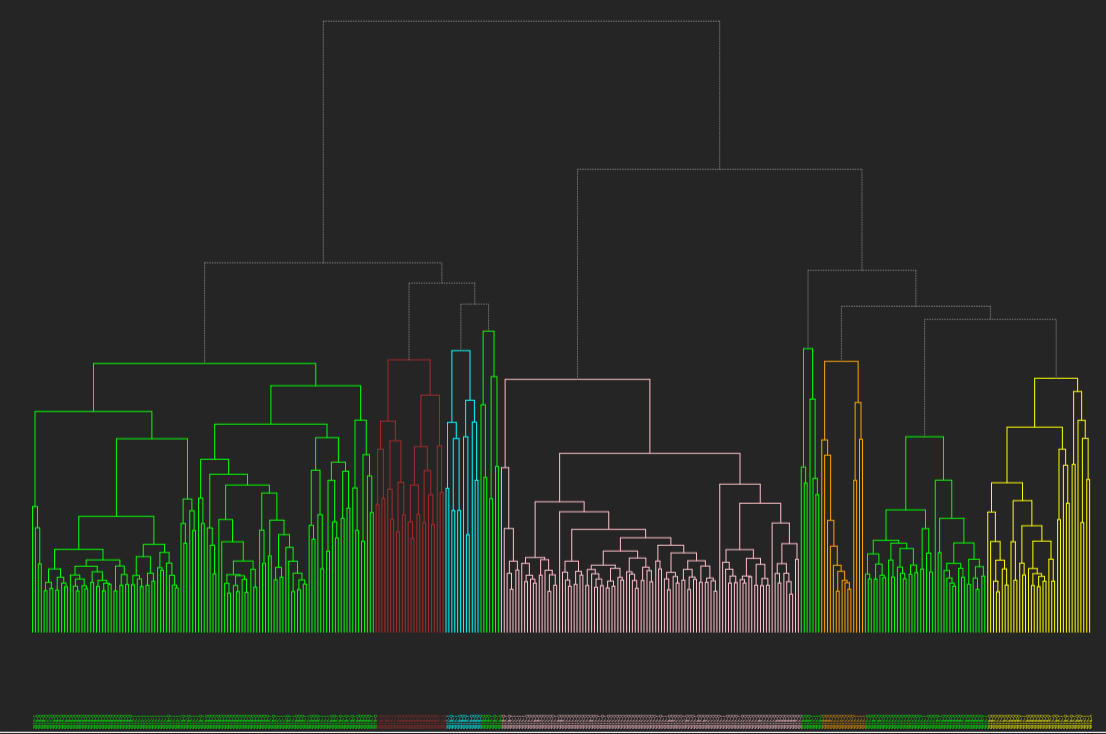
I have performed cluster analysis to generate clusters of days with similar kind of electricity consumption using k-means clustering and hierarchical clustering with custom distance metrics. I have found the optimal number of clusters for every consumer and estimated the variance within and among the clusters. I have also calculated how much variance is reduced before and after the clustering.
Using this cluster information I have tried to find the relation among various factors like day of the week and the holidays. For now, I have developed a small process which takes a date for which consumption has to be predicted, then I find the cluster to which it belongs, and then the average of the cluster for that time is the predicted consumption. And then I calculate how much is the error percentage in the actual and predicted consumption.
What’s Next?
Till now, my analysis was for 85 consumers with 1-year data each. I don’t have direct contact with the company, I have requested SoHPC to request the company to provide data for more years using which I can do a prediction of future year consumption based on their past year’s consumption. After I receive more data, I will be splitting it into training and testing part, perform time series analysis and modeling, and evaluate the results.
Other Updates
I have developed algorithms for data analysis and predicting electricity in the R environment. I have used NoSQL MongoDB to store the dataset. The system is scalable in terms of a large amount of data. Some of the algorithms have been adapted to big databases for parallel processing on multiple nodes. I am working on adapting the rest of the code. I will be writing separate blog posts on these to provide some basic understanding. So, stay tuned!
My name is Khyati and I come from Jaipur (India) – The Pink City. I am studying a Master’s in Data Science at the University of Salford. I am always passionate about continuous learning, finding new and exciting technologies which can prove useful for my data projects. I like working on Data mining (Prediction/Forecasting), Big Data, Advanced Databases, and Text Mining data problems which involves processing, manipulation, statistical analysis, visualization, and modeling.
