Project reference: 1817

Since the emergence of the Next-Generation Sequencing technologies the number of genomics projects has risen exponentially. Human population genomics is an exciting field for research with significant outputs into clinical medicine. While there was just one human genomic sequence in 2001,  we now have more or less complete and de novo assembled genomes from about 50 individuals. Eventually, the overall population variation is well sampled thanks to “1000 Genomes Project”, “100,000 Genomes Project (Genomics England)” and “100,000 Genomes (Longevity)”. Although many tools exist to perform sub-optimal short read sequence alignment, variant calling and phasing, there is still a lot about them to be improved. For example, the existing tools often run in a single-threaded mode and only on the main CPU and often need hundreds of GB of RAM.

The suggested project will improve existing software tools widely used in genomics, especially population genomics.

The main focus will be to contribute to the development of bcftools package (http://samtools.github.io/bcftools/howtos/index.html) in any of the following (ordered with increasing difficulty):

  1. Improve automated tests, fix existing bugs, improve documentation;
  2. Improve efficiency of the implementation;
  3. Improve the built-in query language;
  4. Collect examples of incorrect alignment from publicly available datasets (for future realignment algorithm and implementation);
  5. Conceptually implement IndelRealigner (is to be dropped as a standalone tool from GATK bundle since version 4.0) into “samtools mpileup” or a separate package (so there won’t be a standalone tool anymore which could be used by other tools for comparisons/benchmarking; parts of IndelRealigner will remain in the HaplotypeCaller,however, it is not possible to call the routines from external (3rd-party tools));
  6. Develop a tool to compare VCF/BCF files (a plain UNIX diff does not work practically and SQL-based approaches are too slow). Complex mutations currently need to be split into individual/atomic changes prior to any comparison (“bcftools norm”). An ideal tool would even respect haplotypes and multi-sample VCF/BCF files.

Alternatively, the project will focus on improving java-based GATK (https://software.broadinstitute.org/gatk), IGV (https://github.com/igvteam/igv) or Picard (http://broadinstitute.github.io/picard) tools, or FreeBayes (C++, https://github.com/ekg/freebayes), depending on the preferences of the applicant. Interested candidates should look through currently opened Github Issues, browse the sources and read briefly through the documentation.

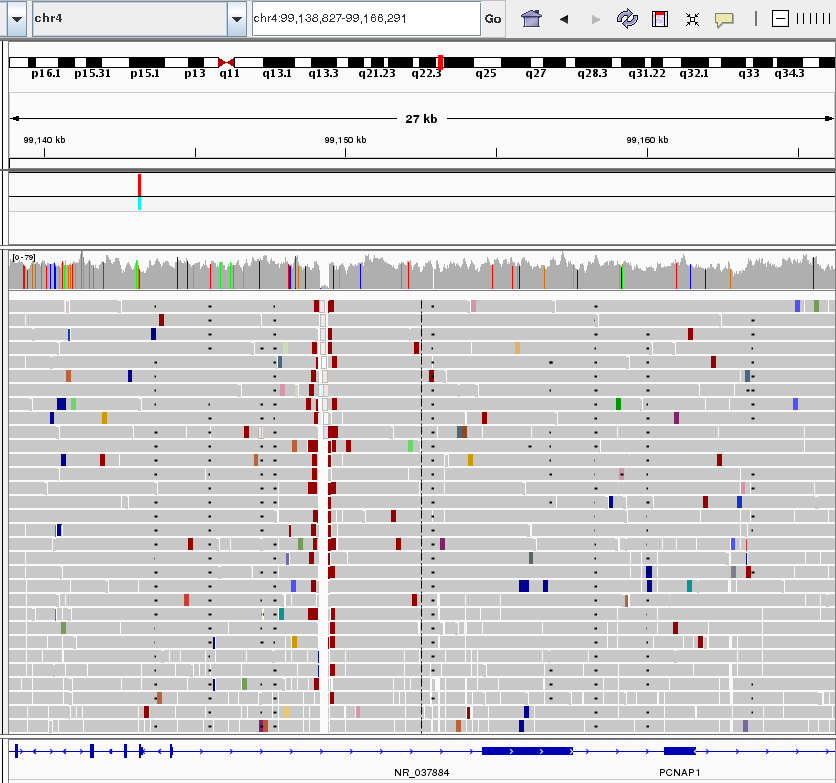
A view of short sequence reads aligned to the human genome reference sequence rendered by IGV software. A low-covered region with a deemed deletion in the chromosome of a proband is visible as a vertical gap. Reads are coloured according to their insert size and orientation. Short black lines (appearing almost as dots) in several columns represent gaps in the sequence alignment of the individual raw sequencing reads.

Project Mentor: Martin Mokrejš, Ph.D.

Project Co-mentor: Petr Daněček, Ph.D.

Site Co-ordinator: Karina Pesatova

Learning Outcomes:
The student will learn about bioinformatic tools, algorithms, genomics, improve his/her programming skills.

Student Prerequisites (compulsory):
MSc. in bioinformatics or computer sciences, proficient in either of C, C++, java, advanced git knowledge, good software programming practice, automated test-suites, Github, TravisCI. Working knowledge of basic genomic concepts. Candidates should become reasonably familiar with the topic, the tools to be worked on and training materials before interview.

Student Prerequisites (desirable):
Statistical genetics, software performance profiling/debugging.

Training Materials:
Documentation, Tutorials, Examples, Testing/Demo data available on the internet.

Workplan:

  • 1st week: Training week.
  • 2nd week: Read documentation, code and test examples, test the tools, fix known but simple bugs (e.g. github pull requests).
  • 3rd week: Sum up the work plan.
  • 4-7th week: Do the main development work.
  • 8th week: Finish the development, document the work, that’s been done write a Final report.

Final Product Description:
The output will be in the form of software documentation, automated tests, accepted patches to existing code fixing bugs or implementing new features.

Adapting the Project: Increasing the Difficulty:
Example topics (see Abstract) are ordered with increasing difficulty. Similar listing will be made if work on another tool(s) is taken. The student will work on more difficult tasks as the time will permit or work on simpler tasks related to another software tool.

Adapting the Project: Decreasing the Difficulty
The student will start with simpler tasks (an example is listed in the beginning of the project description) and continue with more difficult tasks, if possible. Alternatively, will work on simpler tasks on another software tool.

Resources:
The work will utilize Linux-based workstations, remote work on two RedHat-based supercomputer clusters with “PBS Pro” scheduler. Ability to work with bash, git and proficiency in any of the C, C++, java is required for successful work on the project.

Organisation:
IT4Innovations national supercomputing center
project_1615_logo-it4i

Project reference: 1816

In the world of parallel programs, performance plays one of the key roles. There are mature tools (e.g. Scalasca) that enable to inspect the performance of an application, do analysis, and based on this, judge its performance. The aim of this project is to use the results obtained from such an application and visualize them at a higher level of abstraction. Specifically, to visualize the performance data within an abstract model of communication that will be provided.

The student is going to develop a tool that takes as inputs, a performance data and abstract model of communication, and produce a view on the data upon the communication’s model. It is important to note that the data collected from an application’s run can hold two fundamentally distinctive information; statistical data or trace logs (data measured in time). The tool will be able to visualize both kinds of this information. As for the statistical data, it highlights the parts where the application spent most of its time or which path(s) were most used, etc. The visualization of trace logs, on the other hand, will allow the user to see different states in time; a replay of the trace log. Because the statistical information can also be obtained from trace logs, it can be interesting to visualize of their development in time; “cumulative replay”.

Project Mentor: Jan Martinovič, Ph.D.

Project Co-mentor: Martin Šurkovský

Site Co-ordinator: Karina Pesatova

Learning Outcomes:
The student will get acquainted with measuring and performance analysis of parallel programs, plus get an insight to data visualization.

Student Prerequisites (compulsory):
Good level of programming skill, experience with developing GUI applications and processing different file formats.

Student Prerequisites (desirable):
Knowledge of C++ and MPI (point-to-point is enough), and a basic idea about Petri nest, especially Coloured Petri nets.

Training Materials:

  • Message-Passing Interface standard (v3.1, point-to-point communication)
  • Coloured Petri nets (http://www.springer.com/gp/book/9783642002830)

Workplan:
At the beginning, the student should get acquainted with Scalasca tool set, its possibilities, and with standard ways of visualization event-based data. During the second week they should prepare the basic components the tool is going to be composed of, particularly loading and processing input data. After that the visualization of statistical information is in the row (1 – 1.5 week). The rest of the time should be devoted to work on visualizing event-based data (trace logs) and experimenting with visualization of different kinds of data.

Final Product Description:
A tool allowing a user to see performance data collected from a parallel program’s run in the context of its abstract model of communication.

Adapting the Project: Increasing the Difficulty:
The difficulty of the project can be increased by improving the quality of information the user can see, e.g. not only that data are presented but also a more detailed view on the data. The other possibility is to visualize  results of some analyses performed in Scalasca, e.g. critical path.

Adapting the Project: Decreasing the Difficulty
The resulting tool will be with a GUI, hence there is a space for decreasing the difficulty. Moreover, in the worst case, it will be enough to focus just on statistical data and omit the visualization of trace logs.

Resources:

Organisation:
IT4Innovations national supercomputing center
project_1615_logo-it4i

Project reference: 1815

The PI3Ka protein is the most commonly mutated kinase in human malignancies. One of the most common mutations is located in amino acid E545K, where a glutamic acid is replaced by lysine. It has been recently proposed that in this oncogenic mutation, a detachment of the protein catalytic subunit from the protein regulatory subunit happens, resulting in loss of regulation and constitutive PI3Ka activation, which can lead to oncogenesis. To test the mechanism of protein overactivation, enhanced sampling MetaDynamics Molecular Dynamics simulations will be used here to examine the dynamics and  conformations of the mutant PI3Ka protein as they occur in microsecond simulations. The dynamics and structural evolution of this E545K oncogenic protein, as described by our simulations, might reveal possible binding pockets, which will then be exploited in order to design small molecules that will target only the oncogenic mutant protein.

PI3Kα, a lipid kinase that attaches to the cell membrane to function, is the most frequently mutated kinase in human cancers. Understanding the mechanism of overactivation of the most common mutation of the PI3Kα protein, E545K, is central to developing mutant-specific therapeutics for cancer. Using MD simulations we would like to gain insights into the overactivation mechanism of the PI3Kα mutant E545K. The catalytic and regulatory subunits of the protein are shown in purple and green, respectively and the membrane is represented in grey. 

Project Mentor: Dr. Zoe Cournia

Project Co-mentor: Dr Dimitris Dellis

Site Co-ordinator: Aristeidis Sotiropoulos

Learning Outcomes:
Learn how to setup and perform enhanced MD simulations. Analyze enhanced MD simulations with standard tools. Develop own tools and scripts for MD simulation analysis. Understand the protein function and dynamics.

Student Prerequisites (compulsory):
Natural science student (Chemistry, Physics, Engineer) that have familiarity with  or want to learn how to perform computer simulations.

Student Prerequisites (desirable):
Basic programming skills and linux would be desirable.

Training Materials:
See www.drugdesign.gr

Workplan:

  • Week 1. Perform GROMACS and PLUMED Tutorial. Familiarize with linux.
  • Week 2. Setup the protein system. Read the literature on PI3Ka.
  • Week 3. Submit the Work Plan. Familiarize with HPC resources on ARIS, creating and running batch scripts. Submit the MD jobs.
  • Week 4. Familiriaze with analyses tools and perform test calculations on the trajectories.
  • Week 5. Produce enhanced sampling MD trajectories.
  • Week 6. Analyze the trajectories
  • Week 7. Rationalize the results and gain insights into the mechanism of PI3Ka mutant function.
  • Week 8. Write the final report.

Adapting the Project: Increasing the Difficulty:
The project can be made more difficult depending on the analyses that will be performed.

Adapting the Project: Decreasing the Difficulty
The project can be made less difficult by choosing easier analyses.

Resources:
The student will need to have access to ARIS supercomputer facility, the necessary software and analysis tools to run and analyse the trajectories. Local resources for analyses will be provided (office space and desktop).

Organisation:
Greek Research and Technology Network and Biomedical Research Foundation
project_1611_logo-grnet

Project reference: 1814

Structure-based drug discovery (SBDD) is becoming an essential tool in assisting fast and cost-efficient lead discovery and optimization. The application of rational, structure-based drug design is proven to be more efficient than the traditional way of drug discovery, since it aims to understand the molecular basis of a disease and utilizes the knowledge of the three-dimensional structure of the biological target in the process. Virtual screening is a method of structure-based drug design, where large libraries of drug-like compounds that are commercially available are computationally screened against targets of known structure, and those that are predicted to bind well are experimentally tested. Aldehyde dehydrogenase 7A1 (ALDH7A1) is linked to lysine catabolism, protects against hyperosmotic and oxidative stress and is overexpressed in a number of cancer types. The emergence of ALDH7A1 as an important cancer biomarker and its potential therapeutic use, highlight the need for the development of selective inhibitors for this enzyme. However, no antagonists have been developed that inhibit each ALDH isozyme without affecting other isoforms. The only known ALDH7A1 inhibitor to date is 4-diethylaminobenzaldehyde (DEAB), which has been recently crystallized complexed with ALDH7A1. In this project, we will use the freely available AutoDock4 to virtual screen a library of 30M compounds against the protein’s two binding sites in order to identify novel inhibitors of ALDH7A1.

ALDH7A1 is linked to lysine catabolism, protects against hyperosmotic and oxidative stress and is overexpressed in a number of cancer types. Here we propose to perform a virtual screening exercise on human ALDH7A1 to discover small-molecule inhibitors of ALDH7A1 by docking a drug-like database in the ALDH7A1 binding sites.

Project Mentor: Dr. Zoe Cournia

Project Co-mentor: Dr Dimitris Dellis

Site Co-ordinator: Aristeidis Sotiropoulos

Learning Outcomes:
Learn how to setup and perform computer-aided drug design simulations. Perform Virtual Screening (VS). Setup a workflow to perform VS on HPC facilities.

Student Prerequisites (compulsory):
Natural science student (Chemistry, Physics, Engineer) that have familiarity with or want to learn how to perform computer simulations.

Student Prerequisites (desirable):
Basic programming skills and Linux would be desirable.

Training Materials:
See www.drugdesign.gr

Workplan:

  • Week 1. Perform docking Tutorial. Familiarize with linux.
  • Week 2. Setup the protein system. Read the literature on ALDH7A1.
  • Week 3. Submit the Work Plan. Familiarize with HPC resources on ARIS, creating and running batch scripts.
  • Week 4. Create a workflow to submit AutoDock4 calculations on HPC.
  • Week 5. Submit virtual screening calculations on both binding sites of ALDH7A1.
  • Week 6. Postprocess the virtual screening results.
  • Week 7. Rationalize the results and select candidate compounds for experimental testing as inhibitors of ALDH7A1.
  • Week 8. Write the final report.

Adapting the Project: Increasing the Difficulty:
The project can be made more difficult depending on the analysis that will be performed.

Adapting the Project: Decreasing the Difficulty
The project can be made less difficult by choosing easier analysis.

Resources:
The student will need to have access to ARIS supercomputer facility, the necessary software and analysis tools to run and analyse the trajectories. Local resources for analysis will be provided (office space and desktop).

Organisation:
Greek Research and Technology Network and Biomedical Research Foundation project_1611_logo-grnet

Project reference: 1813

EPCC has developed a small, portable Raspberry-pi based cluster which is taken to schools, science festivals etc. to illustrate how parallel computers work. It is called “Wee ARCHIE” (in fact there are two versions in existence) because it is a smaller version of the UK national supercomputer ARCHER. It is actually a standard Linux cluster and it is straightforward to port C, C++ and Fortran codes to it. We already have a number of demonstrations which run on Wee ARCHIE that demonstrate the usefulness of running numerical simulations on a computer, but they do not specifically demonstrate how parallel computing works.

This project aims to develop some new demonstrations that show more explicitly how a parallel program runs. This could  be done by showing a realtime visualisation on the front-end of Wee ARCHIE, or by programming the LED light arrays attached to each of the 16 Wee ARCHIE nodes to indicate when communication is taking place and where it is going (e.g. by displaying arrows). The aim is to make it clear what is happening on the computer to a general audience, for example a teenager who is studying computing at school or an adult with a general interest in IT.

We have existing parallel versions of two simulations that would be interesting to investigate: a simple traffic model and a program that simulates the way that fluid flows in a cavity. Versions are available in both C and Fortran.

The project will involve understanding how these programs work, porting them to Wee ARCHIE, designing ways of visualising how they are parallelised and implementing these visualisations. If successful, these new demonstrations will be used at future outreach events.

The Wee ARCHIE parallel computer, with someone from our target audience for scale!


Project Mentor: Dr. David Henty

Project Co-mentor: Dr. Nick Brown

Site Co-ordinator: Ben Morse

Learning Outcomes:

  • Working with real parallel programs.
  • Learning how to communicate technical concepts to a general audience.

Student Prerequisites (compulsory):
Ability to program in either C, C++ or Fortran and basic knowledge of MPI.

Student Prerequisites (desirable):
Previous experience in visualisation and/or animation would be a bonus.

Training Materials:
The SoHPC training week should give the student all the knowledge they need. The Supercomputing MOOC would also be useful – if this does not run in a suitable timeframe then we can give the student direct access to the material.

Workplan:
The project will start with the student familiarizing themselves with existing parallel programs including a traffic model and a fluid dynamics simulation. The second phase will be porting these to Wee ARCHIE. After that, the student will explore ways of making the parallel aspects more obvious to a general audience, e.g. via realtime visualisations or programming the LED light arrays on WeeARCHIE. The final phase will be implementing these methods and packaging the software up for future development.

Final Product Description:
One or more demonstration applications developed for Wee ARCHIE that can be used at events such as science festivals, and made available more generally for others interested in the public understanding of science.

Adapting the Project: Increasing the Difficulty:
There are many additional programs that could be looked at in addition to the the two simple simulations mentioned above.

Adapting the Project: Decreasing the Difficulty
Only the simpler of the two codes (the traffic model) could be considered. If implementing visualisations on Wee ARCHIE is too difficult, they could be demonstrated in principle on another system (e.g. a laptop) or simply presented as design concepts for later implementation.

Resources:
The student will need access to Wee ARCHIE at some points, but although we have two systems this cannot be guaranteed as they are often offsite at different events. However, we have smaller test and development systems which will be available at all times.

Organisation:
Edinburgh Parallel Computing Centre (University of Edinburgh)
EPCC

Project reference: 1811

The objective of the project will be to improve a data-hub framework (using Apache Kafka, Apache Spark, Elastic Search and Kibana) to collect and to monitor real time environmental data (air composition, groundwater quality, and seismicity data, see links below) using distributed resources (e.g. Jasmine-CEDA) and to create an alert system for interpreting sensors at the field. The alert system will be able to classify  ‘outlier’ values, such as a sensor failure or a natural event (e.g. seismic movement). The alert system will also be able to detect gaps in the sensors (e.g. if there are no values from a specific sensor) and submit notifications.

Project Mentor: Amy Krause

Project Co-mentor: Rosa Filgueira

Site Co-ordinator: Ben Morse

Learning Outcomes:
The student will analyse sensor data from environmental sensors using cloud analytics frameworks and build models to identify outliers. They will learn about Python-based streaming tools, for example Apache Kafka, Apache Spark and Elastic Search.

Student Prerequisites (compulsory):
A strong programming background, with an interest in HPC, parallel programming and real-time data processing and data streaming.

Student Prerequisites (desirable):
Experience in Python, parallel programming techniques, big data engineering and/or the willingness to learn these technologies.

Training Materials:
These will be provided to the successful student once they accept the placement.

Workplan:

  • Week 1&2: Familiarise with the existing framework, the streaming tools and download the data for the examples;
  • Week 3&4: Understand, clean and prepare the sensor data to feed into a model for interpreting the data and classifying potential alerts;
  • Week 5,6,7: Validate and improve the model, and implement an alert system based on the model;
  • Week 8: Final report and demo at the EPCC seminar

Final Product Description:
The final project result will be a feasibility study and/or a prototype to show how an alert system could be implemented.

Adapting the Project: Increasing the Difficulty:
The alert system should create a pluggable framework for different models that the student can build. Create scripts to build a Docker infrastructure for a distributed system and test in real-time.

Adapting the Project: Decreasing the Difficulty
The model can be provided for the student to include in the framework. A subset of the environmental data can be used to build a non-distributed version that can be run on a laptop.

Resources:
A desktop/laptop capable of  running the development tools. Possibly access to cloud infrastructure, for example Azure,  Jasmine which we will apply for.

Organisation:
Edinburgh Parallel Computing Centre (University of Edinburgh)
EPCC

Project reference: 1812

The aim of this project is to explore the effects of upcoming novel hardware, such as NVRAM, on HPC job scheduling. By adapting a workload simulator that is being developed at EPCC to model new hardware, and by using traces of real workloads from HPC systems, we aim to see what the impact of adding such new hardware has on the efficiency of the system with respect to latency and throughput for single and workflow jobs.

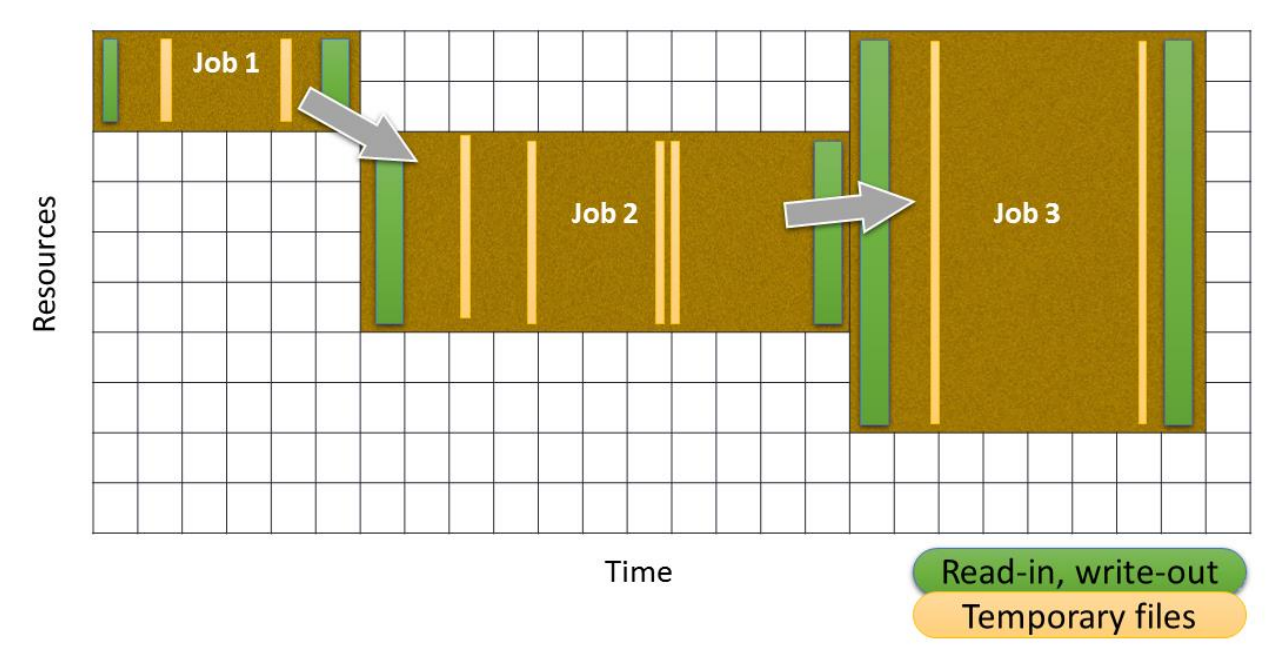
A map of scheduled jobs showing data dependencies
between them – looking for methods of scheduling these
efficiently is one task of this project.

Project Mentor: Dr. Nick Johnson

Project Co-mentor: Manos Farsarakis

Site Co-ordinator: Ben Morse

Learning Outcomes:
The student will learn about different HPC scheduling algorithms, how they interact with the components of a modern HPC system and how upcoming hardware might change the implications of some scheduling assumptions. The student will also learn and develop skills in C++ programming, GNU/Linux and general software engineering.

Student Prerequisites (compulsory):
Some knowledge of C++ including compiling and debugging (using a debugger); general software engineering including version control using git; familiarity with HPC terminology and modern HPC technology.

Student Prerequisites (desirable):
Knowledge of job scheduling algorithms.

Training Materials:
Nothing specific, but general materials on git/C++ from the web should be read to be up to date prior to arrival.

Workplan:
The first two weeks will be spent in the training session and then getting set up with tools (laptop etc.) and learning the code from the mentors. By learning the code, a plan for work will be devised based on what the student wants to do (implementation or algorithm development, software engineering) in the subsequent weeks and the required order (some tasks may require engineering before work can begin). The remaining weeks will be spent on the work, working alongside the mentors before writing up in week 8 and giving a group talk on the project.

Final Product Description: 

  • A study of the impacts of new types of hardware on the efficiency of scheduling systems for HPC;
  • Improved simulator code (better featured, fewer bugs, more performance);
  • Additional algorithms (or tweaked algorithms) implemented.

Adapting the Project: Increasing the Difficulty:
The number, complexity and features of the algorithms could be increased to make the project more difficult.

Adapting the Project: Decreasing the Difficulty
To decrease the difficulty, the student could work on a more straight-forward implementation of scheduling algorithms; improving the speed of the simulator.

Resources:
The student will require access to a laptop, the existing simulator code and input data. All of which will be provided by the host.

Organisation:
Edinburgh Parallel Computing Centre (University of Edinburgh)
EPCC

Project reference: 1810

Energy Efficiency is one of the timeliest problems in managing HPC facilities. Clearly this problem involves many technological issues, including, web visualization, interaction with HPC systems and schedulers, big data analysis, virtual machines manipulations, and authentication protocols.

Our research group prepared a tool to perform real-time and historical analysis of the most important observables to maximize the energy efficiency of an HPC cluster. In the framework of SoHPC 2017, we already developed a web interface that will show the required observable (e.g. the numbers of job running, average temperature of the CPUs per job, top temperatures and other architectural metrics) in the desired time interval.

The web page includes also some statistics about the jobs running in the selected system and a 3D view of the energy load and other observables of the GALILEO cluster.

This year in the framework of the SOHPC program, we aim to improve the capability of this tool and adapt it to the Tier0 Marconi cluster and KNL architecture. We aim also to realize a web interface to plot the energy efficiency observables of the D.AV.I.D.E. cluster based on POWER8 + Nvidia GPUs architecture.

Moving to Tier0 systems will cause an increase in the amount of data produced which will be hard to process visually from system administrators. Deep Learning and Artificial Intelligence can cope with this amount of data and predict and detect anomalies as well as spot for application and system optimization. The student will learn how to combine Deep Learning tools and algorithms with the monitored data to identify possible observable useful to predict possible cluster fault.

Clearly, this tool could help HPC system administrators to:

  • optimize the energy consumption and performance of their machines;
  • avoid unexpected fault and anomalies of the machines.

Project Mentor: Dr. Andrea Bartolini

Project Co-mentor: Dr. Giuseppa Muscianisi

Site Co-ordinator: Dr. Massimiliano Guarrasi

Learning Outcomes:
Increase student’s skills about:

  • Web technologies (e.g. javascript)
  • Python
  • Big Data Analysis
  • Deep learning
  • Open Stack VM
  • Blender
  • HPC schedulers (e.g. Slurm)
  • Internet of Things (MQTT)
  • HPC infrastructures
  • Energy efficiency

Student Prerequisites (compulsory):

  • Javascript or similar web technology
  • Python or C/c++ language (python will be preferred)
  • MPI
  • SLURM

Student Prerequisites (desirable):

  • Cassandra
  • Apache
  • Spark
  • Blender
  • Blender4Web
  • MQTT

Training Materials:

Workplan:

  • Week 1: Common Training session;
  • Week 2: Introduction to CINECA systems, small tutorials on parallel visualization and detailed work planning;
  • Week 3: Problem analysis and deliver final Workplan at the end of week;
  • Week 4, 5: Production phase (set-up of the web page);
  • Week 6, 7: Final stage of production phase (Depending on the results and timeframe, the set of observables will be increased). Preparation of the final movie;
  • Week 8: Finishing the final movie. Write the final Report.

Final Product Description:
An interactive web page will be created. This page will show:

  • a series of parameters related to energy efficiency of a HPC system;
  • some statistics about the jobs running in the selected system;
  • a data analytics tool to search on the databases of observables:
  • an interactive 3D plot of Marconi system.

Adapting the Project: Increasing the Difficulty:
The student will help us to prepare a 3D rendering of the MARCONI cluster, via Blender4Web in order to visualize the energy load directly on the cluster. The student will work with Deep Neural Network algorithm to study predictive anomaly detection in the Marconi cluster.

Adapting the Project: Decreasing the Difficulty
If necessary, we can reduce the effort, creating only a webpage showing job running in the cluster, and some other statistical information extracted form oud DB.

Resources:
The student will have access to our facility, our HPC systems, the two databases containing all energy parameters, and job information. They will also manage a dedicated virtual machine.

Organisation:
CINECA
cineca_logo

Project reference: 1809

Visualization of cavitation is currently a very interesting topic. In the project, results from previous HPC simulations will be provided as a base to develop a visualization strategy based on advanced open-source tools.

Starting from an already developed In Situ visualization interface for OpenFoam, we propose to also develop a web 3D visualization tool that can be used online to check the correctness of the simulations but that may also be adopted offline (i.e. for post-processing) to explore the time evolution of the 3D fields of the model.

Such tool will be designed and implemented to be portable to other coupled modelling systems.

Project Mentor: Prof. Federico Piscaglia

Site Co-ordinator: Simone Bnà

Learning Outcomes:
Increase student’s skills about:

  • PARAVIEW (Catalyst, ParaviewWeb)
  • OpenFOAM
  • PYTHON
  • C++
  • MPI
  • Managing resources on Tier-0 and Tier-1 systems
  • Batch scheduler (PBS)
  • Remote visualization
  • Batch visualization of scientific data (ParaViewCINEMA)
  • Video and 3D editing (Blender)

Student Prerequisites (compulsory):
Knowledge of:

  • OpenFOAM (basic)
  • Python : strong
  • ParaView : good
  • C++: good (Fortran is better)
  • Linux/Unix: strong

Student Prerequisites (desirable):
Knowledge of:

  • MPI
  • Blender

Training Materials:
None

Workplan:

  • Week 1: Common Training session
  • Week 2: Introduction to CINECA systems, small tutorials on parallel visualization and detailed work planning.
  • Week 3: Problem analysis and deliver final Workplan at the end of week.
  • Week 4, 5: Production phase (A proper visualization workflow will be implemented starting from existing outputs).
  • Week 6, 7: Final stage of production phase (Depending on the results and timeframe, the visualization scripts will be adapted to the production workflow). Preparation of the final movie.
  • Week 8: Completing the final movie. Write the final Report.

Final Product Description:
The purpose of this project is to integrate a visualization tool within the OpenFOAM combustion model workflow. Our final product will consist of a visualization web interface based on ParaView Web as well as a movie illustrating the use and the results obtained during this 2 months work period. In addition, a small report on the work done will be produced.

Adapting the Project: Increasing the Difficulty:
If we will have enough time we could expand the project into two directions:

  • Use the batch workflow of ParaView (ParaView CINEMA) to pre-compute all relevant visualization artefacts during simulation phase
  • We can also create several visualization pipelines for analysis purposes.

Adapting the Project: Decreasing the Difficulty

  • A simple web interface to Paraview will be developed, and put in production.
  • A very simple movie showing the web interface will be prepared.

Resources:
The software OpenFOAM, released by the OpenFOAM Foundation and by OpenCFD will be provided togeher with all the open-source software neeed for the work (e.g. ParaView and Blender). The software is already available on the CINECA clusters that will be used by the students with their own provided accounts.

Organisation:
CINECA
cineca_logo

Project reference: 1808

This project is, to a large extent, a continuation of the last year’s SoHPC effort, where we demonstrated a notable increase of the efficiency of popular machine learning algorithms, such as K-means, when implemented using C/C++ and MPI – over those provided by Apache Spark MLlib.

The goal of the project remains the same: Demonstrate that “traditional” HPC tools are (at least) just as good, or even better, than the JVM-based technologies for big data processing – such as the Hadoop MapReduce or Apache Spark. There is no doubt about that performance advantages of C/C++ or Fortran compiled codes over those running on top of JVM (be it Java, Scala or other). The performance clearly is important, but not the only metrics to judge, which of the approaches is better. We also have to address other aspects, in which popular tools for big data processing such as the Apache Spark, shine – that is the run-time resilience and parallel, distributed data processing.

The problem of MPI run-time resilience is a vivid research field for a past few years and several approaches are now application ready. We plan to use GPI-2 API (http://www.gpi-site.com/gpi2) implementing GASPI (Global Address Space Programming Interface) specification, which offers (among other features) mechanisms to react to failures.

The parallel, distributed data processing in the traditional big data world is made possible using special filesystems, such as the Hadoop file system (HDFS) or other similar file systems. HDFS enables data processing using the information of data locality, i.e. to process data that is “physically” located on the compute node, without the need for data transfer over the network. Despite it is the many advantages, HDFS is not particularly suitable for deployment on HPC facilities/supercomputers and use with C/C++ or Fortran MPI codes, for several reasons. Within the project, we plan to explore other possibilities (in-memory storage / NVRAM, and/or multi-level architectures, etc.) and search for the most suitable alternative to HDFS.

Having a powerful set of tools for big data processing and high-performance data analytics (HDPA) built using HPC tools and compatible with HPC environments, is highly desirable, because of a growing demand for such tasks on supercomputer facilities.


Project Mentor: Doc. Mgr. Michal Pitonák, PhD.

Project Co-mentor: Mgr. Lukáš Demovič, PhD.

Site Co-ordinator: Mgr. Lukáš Demovič, PhD.

Learning Outcomes:
The student will learn a lot about MPI and GPI-2 (C/C++ or Fortran), Scala programming language, Apache Spark as well as ideas of efficient use of tensor-contractions and parallel I/O in machine learning algorithms.

Student Prerequisites (compulsory):
Basic knowledge of C/C++ or Fortran, MPI and (at least one of) Scala or Java.

Student Prerequisites (desirable):
Advanced knowledge of C/C++ or Fortran, MPI, Scala, basic knowledge of Apache Spark, big data concepts, machine learning, BLAS libraries and other HPC tools.

Training Materials:

Workplan:

  • Week 1: Training.
  • Weeks 2-3: Introduction to GPI2, Scala, Apache Spark (and MLlib) and efficient implementation of algorithm.
  • Weeks 4-7: Implementation, optimization and extensive testing/benchmarking of the codes.
  • Wweek 8: Report completion and presentation preparation.

Final Product Description:
The expected result of the project is a resilient (C/C++ or Fortran) GPI-2 implementation of several popular machine learning algorithms on a data locality-aware parallel filesystem, yet to be chosen. Codes will be benchmarked and compared with the state-of-the-art implementations of the same algorithms in Apache Spark MLlib or other “traditional” big data/HDPA technologies.

Adapting the Project: Increasing the Difficulty:
The choice of machine learning algorithms to implement depends on the student’s skills. Even the simplest algorithms are difficult enough to be implemented towards the run-time resilience.

Adapting the Project: Decreasing the Difficulty
Similar to “increasing difficulty”. We can choose the simplest machine learning algorithms or, in the worst case, sacrifice either the requirement of resilience or the use of a next generation files system.

Resources:
The student will have access to the necessary learning material, as well as to our local IBM P775 supercomputer and x64 infiniband clusters. The software stack, we plan to use, is open source.

Organisation:
Computing Centre of the Slovak Academy of Sciences

Project reference: 1807

In calculations of nanotubes methods prevailing are based on a one-dimensional translational symmetry using a huge unit cell. A pseudo two-dimensional approach, when the inherent helical symmetry of general chirality nanotubes is exploited and has been limited to simple approximate model Hamiltonians. Currently, we are developing a new unique code for fully ab initio calculations of nanotubes that explicitly uses the helical symmetry properties. Implementation is based on a formulation in two-dimensional reciprocal space where one dimension is continuous whereas the second one is discrete. Independent particle quantum chemistry methods, such as Hartee-Fock and/or DFT or simple post Hartree-Fock perturbation techniques, such as Moller-Plesset 2nd order theory, are used to calculate the band structures.

The student is expected to cooperate on the further parallelization of this newly developed implementation and/or on performance testing for simple general nanotube model cases. Message Passing Interface (MPI) will be used as the primary tool to parallelize the code.

The aim of this work is to improve MPI parallelization to enable highly accurate calculations for the band structures of nanotubes on distributed nodes, with distributed memory. Furthermore, the second level parallelization in inner loops over the processors of individual nodes would certainly enhance the performance together with a combination with using threaded BLAS routines.

By improving the performance of our new software, we will open up new possibilities for tractable highly accurate calculations of energies and band structures for nanotubes with predictive power and with facilitated band topology whose interpretation is much more transparent than in the conventionally used one-dimensional approach. We believe that this methodology will soon become a standard tool for in-silico design and investigation in both the academic and commercial sectors.

General case nanotube with helical translational symmetry.

Project Mentor: Prof. Dr. Jozef Noga, DrSc.

Project Co-mentor: Mgr. Lukáš Demovič, PhD.

Site Co-ordinator: Mgr. Lukáš Demovič, PhD.

Learning Outcomes:
The student will familiarize themself with MPI programming and testing, as well as with ideas of efficient implementation of complex tensor-contraction based HPC applications. A basic understanding of treating the translationally periodic systems in physics will be gained along with the detailed knowledge of profiling tools and parallelization techniques.

Student Prerequisites (compulsory):
Basic knowledge of MPI and Fortran.

Student Prerequisites (desirable):
BLAS libraries and other HPC tools, knowledge of C/C++.

Training Materials:
Articles and test examples to be provided according to an actual students profile and skills.

Workplan:

  • Weeks 1-3: Training; profiling of the software and design simple MPI implementation, Deliver Plan at the end of week 3.
  • Weeks 4-7: Optimization and extensive testing/benchmarking of the code.
  • Week 8: Report completion and presentation preparation.

Final Product Description:
The resulting code will be capable of successfully and more efficiently completing the electronic structure calculations of nanotubes with a much simplified and transparent topology of the band structure.

Adapting the Project: Increasing the Difficulty
A more efficient implementation with the hybrid model using both MPI and Open Multi-Processing (OpenMP).

Adapting the Project: Decreasing the Difficulty
Profiling of the code to provide key information on the bottlenecks and a simple MPI parallelization of the main loops.

Resources:
The student will need access to Fortran and a C++ compiler as well as MPI and OpenMP environment which can be provided by the host CC SAS.

Organisation:
Computing Centre of the Slovak Academy of Sciences

Project reference: 1806

This project will involve optimising lattice Quantum Chromodynamics (lattice QCD) codes, which currently run on PRACE Tier-0 and other European Peta-scale supercomputers. Lattice QCD is a method to study Quantum Chromodynamics, the theory which describes how quarks bind to form the protons, neutrons and all other hadrons which make up the visible mass observed in the universe. Within lattice QCD, one simulates the complex strong interactions, one of the four fundamental forces of nature, directly from the underlying theory.

Using lattice QCD, important fundamental questions can be addressed, such as how the quarks are distributed inside protons and neutrons and what fraction of their intrinsic spin, momentum and helicity is carried by the quarks and gluons. These hadron structure calculations require large computer allocations and run on the world’s largest supercomputers.

Multigrid solvers have enabled simulations of QCD using physical quark masses, a milestone in the field that allows direct contact with experiment and input to searches for new physics. In this project, the software package “DDalphaAMG” will be optimized for novel architectures, including KNLs and Skylake. DDalphaAMG is a state-of-the-art solver library that implements an algebraic multigrid algorithm for an arbitrary number of levels. Its scalability however, is limited by the inefficient threading model currently employed. This project will involve optimizing DDalphaAMG to accommodate future HPC trends that are evolving to architectures with wide vector registers and hundreds of threads per node.

A first step of the project will include an analysis of the scalability of the code which will introduce the selected student to the code and the environment. The performance when using different parallelization strategies, such as OpenMP combined with MPI, will be quantified. In the final phase, the student will optimize kernel functions by exploiting vector intrinsics and/or optimizing the OpenMP parallelization according the previous analysis.


Multigrid methods efficiently solve large sparse linear systems of equations by first “smoothing” the matrix to be solved and subsequently solving a ?coarsened? system as a preconditioner of the original, finer system.

Project Mentor: Constantia Alexandrou

Project Co-mentor: Giannis Koutsou

Site Co-ordinator: Stelios Erotokritou

Learning Outcomes:
The summer student will perform runs on PRACE Tier 0 systems and will familiarize themselves with using world-leading supercomputing infrastructures. The student will be trained on exploiting different parallelization strategies and optimizations for modern computing architectures. The training will include an introduction to lattice QCD techniques.

Student Prerequisites (compulsory):
Undergraduate degree in Physics with grade above average and good programming experience.

Student Prerequisites (desirable):
Knowledge of Theoretical High Energy Physics; Experience with parallel programming, Experience with OpenMP and vectorization programming.

Training Materials:

  • Lattice Gauge Theories-Introduction, Heinz J Rothe,
  • World Scientific Quantum Chromodynamics on the Lattice, Gattringer, Lang, doi 10.1007/978-3-642-01850-3, Springer-Verlag Berlin Heidelberg
  • Lattice Quantum Chromodynamics, Knechtli, Günther, Michael and Peardon, DOI: 10.1007/978-94-024-0999-4, Springer Netherlands

Workplan:

  • Week 1
    In the first week, the summer student will attend the PRACE SoHPC training program.
  • Week 2-4
    From the second to the fourth weeks, the summer student will familiarize themselves with the code and will perform first runs on the target machines. This includes compiling of the software, optimization of some model parameters and an introduction to multigrid solvers in lattice QCD by local experts of the group.
  • Week 4-7
    In the remaining weeks, the summer student will perform OpenMP/MPI performance analysis and begin optimizing the kernel functions.
  • Week 8
    Refinement of results and prepare final presentation. Hand-over code to local researchers.

Final Product Description:
The final project result will be an optimized and more scalable code. The results will be provided in a report which summarizes the performance analysis and optimizations carried out.
Graphics will be provided to demonstrate the improvement in performance and scalability of the code, and diagrams will be used to visualize the optimizations carried out.

Adapting the Project: Increasing the Difficulty
The intensity/difficulty of the project can be increased by targeting more advanced optimization strategies for the kernel functions.

Adapting the Project: Decreasing the Difficulty
The intensity/difficulty of the project can be decreased by extending the first phase of the project (parameter space exploration). Here, more weight can be given to parameter optimization for specific lattice sizes.

Resources:
The summer student will be provided access to a PRACE Tier-0 systems equipped with Intel Skylake and KNL processors, including SuperMUC, Marconi, and Jureca, including its booster partition.
In addition, the student will be given access to local infrastructure that includes a small cluster of Xeon Phi (KNC) processors that can be used for prototyping of the kernel functions.

Organisation:
The Cyprus Institute – Computation-based Science and Technology Research Center


Project reference: 1805

Lattice Quantum Chromodynamics (lattice QCD) can solve and predict physics in the low energy regime of particle physics where analytical methods such as perturbation theory are not applicable. Realistic simulations of QCD are carried out using Markov Chain Monte Carlo for producing configurations with lattices of billions of degrees of freedom. High Performance Computing is therefore crucial for calculating observables within lattice QCD that can be compared to experiment and/or provide insights to searches for physics beyond the Standard Model.

The project will target optimization of a lattice QCD simulation code to use GPUs. Namely, the tmLQCD package will be developed to call the appropriate functions of the GPU library QUDA. The PizDaint supercomputer at CSCS in Switzerland will be used to develop, benchmark and scale the implementation.

Analysis codes using QUDA have already been developed and are running on PizDaint via projects secured by the local group. Enabling simulation codes via this project will mean that both major components of any lattice QCD calculation will have been enabled on GPUs, thus contributing major efforts in future-proofing these community codes for Exascale.

The summer student will obtain access to this machine in order to carry out the project, which includes optimization for lattice QCD simulations with Nf=2 twisted mass fermions. Here the challenge is to optimize the Hybrid Monte Carlo (HMC) setup such that the precision is high enough to yield a high acceptance rate while keeping the computational costs moderate. For the HMC, a nested fourth order integrator, in combination with Hasenbusch mass preconditioning will be used. The challenge is to identify an optimal set of solvers for each of the multiple Hasenbusch mass terms. This involves scanning the parameter space of Hasenbusch masses while measuring the time to solution of the solvers to obtain the combination that yields the smallest time-to-solution.

Analyses on PizDaint have enabled the calculation of the so-called σ-terms, observables that probe interactions of dark matter with nucleons and can therefore guide dark matter searches in experiments. The project will enable the next level of such measurements by porting the simulation component to the PizDaint architecture. Source: https://www.cscs.ch/science/physics/supercomputers-on-the-trail-of-dark-matter/

Project Mentor: Giannis Koutsou

Project Co-mentor: Constantia Alexandrou

Site Co-ordinator: Stelios Erotokritou

Learning Outcomes:
The summer student will perform runs on PizDaint, a PRACE Tier 0 system, and analyse solver performance on GPUs. The summer student will be introduced to basic concepts of Monte Carlo algorithms in lattice QCD.

Student Prerequisites (compulsory):
Undergraduate degree in Physics with grade above average and good programming experience.

Student Prerequisites (desirable):
Knowledge of Theoretical High Energy Physics; Experience with parallel programming, Experience with GPU programming

Training Materials:

  • Lattice Gauge Theories – An Introduction, Heinz J Rothe,
  • World Scientific Quantum Chromodynamics on the Lattice, Gattringer, Lang, doi 10.1007/978-3-642-01850-3, Springer-Verlag Berlin Heidelberg
  • Lattice Quantum Chromodynamics, Knechtli, Günther, Michael and Peardon, DOI: 10.1007/978-94-024-0999-4, Springer Netherlands

Workplan:

  • Week 1
    During the first week, the summer student will attend the PRACE SoHPC training week.
  • Week 2-4
    From the second to the fourth weeks, the summer student will perform some first runs on PizDaint for familiarizing with the code and the supercomputer environment. This includes, compiling of the software, running the different solvers, and carrying out an introductory tutorial to multigrid solvers and HMC simulations in lattice QCD by experts from the local group.
  • Week 4-7
    In the fourth to seventh week, the summer student will evaluate different configurations of a nested fourth order integrator by measuring the energy violation during the molecular dynamics update. By varying the step-size and the Hasenbusch masses, an optimal cost for a given energy violation can be obtained. Moreover, possible parameter corrections can be implemented in the calls to the solvers.
  • Week 8:
    Refine results and prepare final presentation, hand-over to local researchers.


Final Product Description:
The final results of the project will be an optimized Nf=2 twisted mass clover HMC simulation code that can be deployed on PizDaint. A report will include graphics to visualize the performance improvement obtained by the use of GPUs. Diagrams will also be used to visualize the parameter space search for obtaining the optimal set of HMC parameters.

Adapting the Project: Increasing the Difficulty
The intensity/difficulty of the project can be increased by comparing different integrators, such as between second and fourth order integrators. Moreover, the optimization can be extended to a GPU machine with different communication architecture for comparison.

Adapting the Project: Decreasing the Difficulty
The intensity/difficulty of the project can be decreased by reducing the QUDA functions called to the bare minimum (i.e. only the solver).

Resources:
The student will obtain access to PizDaint where the local group currently carries out analysis of lattice QCD configurations.

Organisation:
The Cyprus Institute – Computation-based Science and Technology Research Center


Project reference: 1803

In this project we want to introduce the student to the field of malleability of scientific applications. We understand malleability as the capacity of a multi-process job to be resized on-the-fly, in other words, to change the number of processes (and reallocate resources) during the execution time.

For the last years, malleability has proven to be an interesting solution for high-throughput computing (HTC) and energy saving in large high-performance facilities.

For this purpose, we presented the dynamic management of resources library (DMRlib), a tool for malleability that assists developers to easily convert their applications into malleable. Furthermore, we developed a reconfiguration policy, responsible for deciding when and how job malleability has to take place.

In order to extend the prospective of malleability from other approaches, such as: resource heterogeneity, job priorities, power-awareness, we have to implement job reconfiguration policies that takes into account the information related to their goal. For this reason, in this project we propose the development of a simulator, which will simulate the execution of a workload composed of malleable and non-malleable jobs, over a parallel system.

With this simulator, we will parametrize the jobs (not all of them have to be malleable) and tune the reconfiguration policies in order to determine the best configuration for fulfilling a given target.

Project Mentor: Sergio Iserte

Project Co-mentor: Rafael Mayo

Site Co-ordinator: Maria-Ribera Sancho

Learning Outcomes:
The student will learn about resource management and distributed applications. Furthermore, the student will better understand how HPC production systems work during the execution of a parallel workload.

Student Prerequisites (compulsory):
Basic knowledge of Python and distributed computation models like MPI.

Student Prerequisites (desirable):
For the development of the simulator, we will use SimPy, so previous knowledge of this library will be appreciated. It is also desirable to be familiar with resource manager systems (RMS).

Training Materials:

Workplan:

  • Week 1: Training week
  • Week 2: Literature Review Preliminary Report (Plan writing)
  • Week 3 – 7: Project Development
  • Week 8: Final Report write-up

Final Product Description
The result will be a modular configurable simulator, which manages jobs of different features and handles different policies for selecting resources, scheduling and reconfiguring jobs.

Adapting the Project: Increasing the Difficulty
The project can be adapted to the difficulty by implementing more/less complex policies for resource management, job scheduling and reconfiguring.

Resources:
The student will have a workstation and access to the research cluster of our group in order to validate the outcomes.

Organisation:
Universitat Jaume I, Castelló de la Plana, Spain

Project reference: 1802

Energy minimization is critical in current and future computing platforms in fields such as HPC and embedded systems. While for the former it is a requirement to achieve exascale systems, the latter usually features strong power and/or autonomy constraints.

GPU accelerators provide great energy efficiency per FLOP, but they are still power-hungry devices, spending a large portion of the power budget. Hence, it is of high relevance to perform an efficient use of those. The maximum efficiency however, is attained at different CPU and GPU frequencies depending on the applications usage pattern of these processors and their memories.

We have carried out initial work toward automatic CPU and GPU frequency scaling for embedded platforms, seeking energy-to-solution minimization. Based on an in-house software-based power monitor, we have measured the energy consumption of a set of representative coprocessor usage patterns and kernels for a range of CPU and GPU frequencies in a Jetson TX1 platform. These measurements show significant difference in energy consumption for different frequencies of these processors, but its correlation to the program features is not obvious and different benchmarks yield to considerably different curves. We expect the intern to analyze our data (and possibly to leverage further experiments) to identify the program features to leverage and how to extract from these the optimum CPU/GPU frequency. Techniques to be applied will be explored and discussed, including, but not limited to, machine learning approaches. An automatic CPU/GPU frequency manager is expected to be developed based on the knowledge developed during the internship.

Example of energy consumption vs. GPU and CPU frequency.

Project Mentor: Antonio J. Pena

Site Co-ordinator: Maria-Ribera Sancho

Learning Outcomes:

  • CPU/GPU frequency scaling implications on energy consumption.
  • System software development for frequency scaling.

Student Prerequisites (compulsory):

  • C, CUDA
  • Machine learning

Student Prerequisites (desirable):

  • Feature selection, optimization and search problems.
  • System software development (Linux).

Training Materials:

Workplan:

  • Week 1: Training
  • Week 2: Literature review and plan report development
  • Week 3-7: Project development
  • Week 8: Development of final report

Final Product Description:
An automatic frequency scaler.
A scientific paper and/or technical report.

Adapting the Project: Increasing the Difficulty
We can seek for higher accuracy and further application usage patterns.

Adapting the Project: Decreasing the Difficulty
The student will be backed by members of the team in case an unplanned increase of difficulty arises. We can adapt to lower than expected accuracy. The actual development of the automatic frequency scaling can also be converted into a guided frequency scaling (expected to be of easier implementation).

Resources:
A laptop and NVIDIA TX1 boards. We expect the student to bring his own laptop; we will provide them with access to our set of TX1 boards.

Organisation:
Barcelona Supercomputing Centre

BSC_logo

Project reference: 1804

This project is based on LAMMPS, a classical molecular dynamics code, used to model atoms or, more generically, as a parallel particle simulator at the atomic, meso, or continuum scale.

LAMMPS runs on single processors or in parallel using message-passing techniques and a spatial-decomposition of the simulation domain. Many of its models have versions that provide accelerated performance on CPUs, GPUs, and Intel Xeon Phis. The code is designed to be easy to modify or extend with new functionality.

In this project, we aim to convert the MPI version of LAMMPS in malleable, in other words, a version of LAMMPS able to be resized, in terms of number of processes, during its execution time.

For the last years, malleability has proven to be an interesting solution for high-throughput computing (HTC) and energy saving in large high-performance facilities. From previous works, we have learned how remarkable is the effect of the dynamic reconfiguration in the execution of a workload composed, partly or wholly, of malleable jobs. Since LAMMPS is a well-known HPC application, used in a wide range of scientific fields, we are interested in obtain a reconfigurable version of it and analyze its behavior when it is included in a workload.

Project Mentor: Sergio Iserte

Project Co-mentor: Rafael Mayo

Site Co-ordinator: Maria-Ribera Sancho

Learning Outcomes:
The student will learn about the structure of modern scientific software and distributed computation.

Student Prerequisites (compulsory):
A good knowledge of C++ and MPI is required.

Student Prerequisites (desirable):
It is also desirable to be familiar with resource manager systems (RMS).

Training Materials:
https://slurm.schedmd.com/tutorials.html

Workplan:

  • Week 1: Training week
  • Week 2: Literature Review Preliminary Report (Plan writing)
  • Week 3 – 6: Project Development
  • Week 7: Throughput analysis
  • Week 8: Final Report write-up

Final Product Description:
The result will be a malleable version of LAMMPS and the subsequent performance/throughput analysis in a workload of more jobs.

Adapting the Project: Increasing the Difficulty:
The project can be adapted to the difficulty by including more LAMMPS features to the reconfiguration.

Adapting the Project: Decreasing the Difficulty:
The difficulty can be decreased by using other molecular dynamics code such as miniMD.

Resources:
The student will have a workstation and access to the research cluster of our group.

Organisation:
Universitat Jaume I, Castelló de la Plana, Spain

Project reference: 1801

The parallel solution of PDEs using numerical methods for unstructured meshes is based on the partitioning of the mesh. All operations, like algebraic system assembly and solution are then performed in parallel, and communications are essentially present in this second step. However, the partitioning is not necessarily adapted to both operations, in terms of load balance and communications. The present project proposes an adapted multi-partitioning where two different partitions are generated, one for the algebraic system assembly and one for the algebraic system solution through iterative solvers. The matrix assembled in the first step is communicated to the partitions dealing with the solution which, at its turn, provides the system solution. The programming strategy proposed is based on a code coupling, each instance dealing with one of the two steps. In our case, a single code – Alya, will be considered. The methodology will be benchmarked in the numerical and HPC contexts.

Coupling of algebraic system assembly and algebraic system solution through an adaptive multi-partitioning technique.

Project Mentor: Guillaume Houzeaux

Project Co-mentor: Ricard Borrell

Site Co-ordinator: Maria-Ribera Sancho

Learning Outcomes:
Parallel programming with MPI, OpenMP, Dynamic Load balance techniques, performance analysis, as well as basics on the finite element method and iterative solvers, and for sure, team work!

Student Prerequisites (compulsory):
Programming, numerical methods, team work, benchmarking, performance analysis.

Workplan:

  • Week 1:Introduction to MPI, OpenMP, finite element and iterative solvers with Alya team. Training with Paraver.
  • Week 2: Introduction to Alya and definition of benchmarks.
  • Week 3-8: Testing of the methodology and performance analysis.
  • Week 8: Report

Final Product Description:
A novel technique adapted to the different steps of general PDEs solvers by means of a multi-partitioning technique. A testing of the viability of such technique using code coupling.

Adapting the Project: Increasing the Difficulty
A priori, all the algorithms will be coded. However, scheduling strategies could be added to reduce the communication time; dynamic load balance can be further implemented in more kernels.

Adapting the Project: Decreasing the Difficulty
Reducing the size of the problem, or focussing on less benchmarks.

Resources:
Documentation of Alya. MPI, OpenMP documentations. Introduction to the finite element method and iterative solvers.

Organisation:
Barcelona Supercomputing Centre

BSC_logo

1. Introduction

In an age marked by data-driven knowledge, visualisation plays a major role for exploring and understanding datasets. Visualisations have an amazing ability to condense, analyse, and communicate data as if telling a story with numbers. In contrast to text-based means, the interpretation of visual information happens immediately in a pre-attentive manner. It is worth mentioning that the usefulness of data visualisation was introduced early in John Tukey’s landmark textbook Exploratory Data Analysis (Tukey, 1977).

In this post, I present an interactive visualisation that can help explore how the world’s centre for supercomputing has been changing since 2005. To put it in more detailed words, the visualisation answers which countries dominated the possession of supercomputers from 2005 to 2017.  The visualisation can be accessed directly from the URL below:

https://goo.gl/y8c9NB

The rest of the post gives an overview of the visualisation, how it was designed, and my personal reflections on the visualisation outcome.

2. Visualisation Pipeline

The visualisation is delivered as a web-based application. The visualisation was produced over the stages sketched in Figure 1. First, the data was collected from the Top500.org lists between the years of 2005 to 2017. The data was scrapped using a Python script that utilised the urllib and BeutifulSoup modules. Data included information on rankings and locations of the Top 500 supercomputers in each year. The location info (i.e. country) was utilised to get latitude and longitude coordinates using Google Maps API.

Subsequently, the data was transformed into the JSON format, again using Python. The JSON-structured data defined the markers to be plotted on the map. The JSON output is described as the “Data Layers” by Google Maps API. The map visualisation is rendered using Google Maps API along with the JSON data layers. Eventually, the visualisation is integrated within a simple web application that can provide interactivity features as well. All the code along with scrapped data are accessible from my GitHub below:
https://github.com/Mahmoud-Elbattah/Top500_Viz_2005-2017

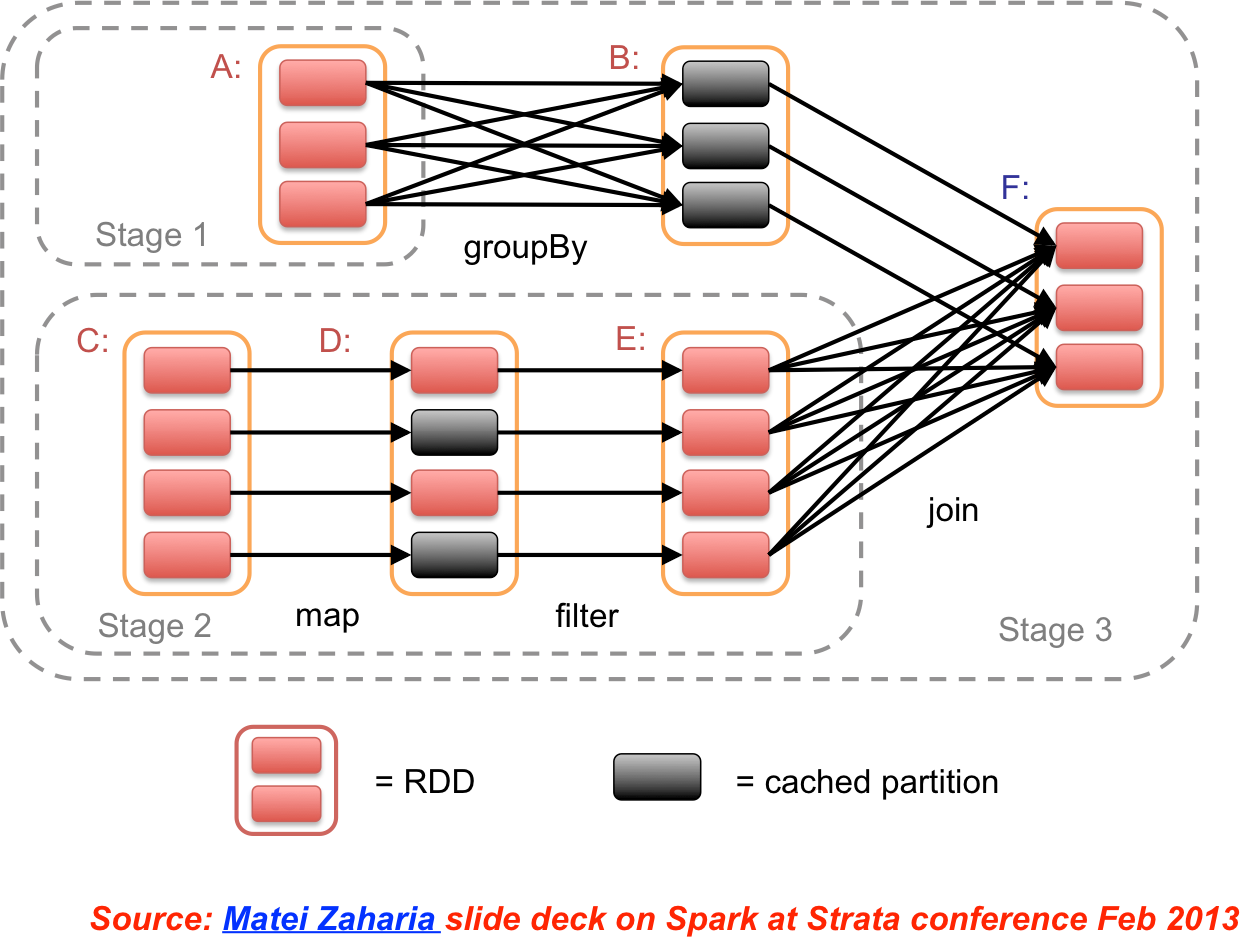
Figure 1: Overview of visualisation Pipeline.

3. Visual Design

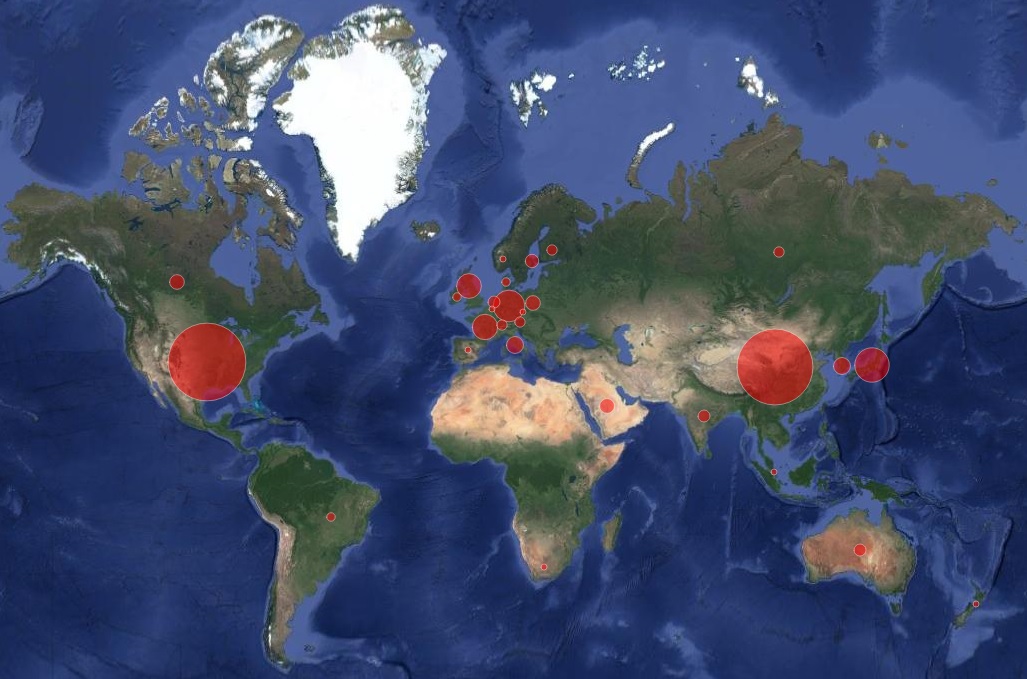
The visualisation is provided on top of Google Maps. Map markers are drawn on the map as circles (Figure 2). Particularly, every circle is placed on a country where at least one supercomputer was included in the Top500 list. The circle radius represents the percentage of possessed supercomputers with respect to the Top500 list in a specific year. For example, Figure 2 visualises the Top500 list in the year 2014. At glance, it can be learned that the USA was the largest incubator of supercomputers in that year.

Figure 2: Visual design.

4. Interactivity

It was aimed to provide a flexible way that can portray how the world’s centre for supercomputing changed over the years 2005-2017. In this regard, a JQuery-based slider is used, which serves as a slide-able timeline. The visualisation is loaded automatically as the user slides the years forward or backward. In addition, the map markers show more info (e.g. number of supercomputers) as the mouse cursor moves over.

5. Reflections on Visualisation

It is quite interesting how the picture changed over the years. In 2005, China had only 19 supercomputers in the Top500 list, compared to 277 owned by USA. Today, China has 160 supercomputers, which makes it stand on equal footing with USA. This translates into how the world’s centre for supercomputing continues to shift eastwards.

The visualisation also shows what can be described as the rise and fall of some countries in the Top500 list. An adequate example is the case of Israel and Poland. On one hand, there were 8 supercomputers in Israel in 2005. That figure has been fluctuating till 2015, and since 2016 Israel had no supercomputers listed in the Top500 at all. On the other hand, Poland had no existence in the Top500 list before the year 2008. However, the number of supercomputers in Poland has been usually increasing since 2008, and has currently reached 6 in 2017. Those are just examples, and I am looking forward to hearing further interesting observations from the SoHPC community.

References

Tukey, J.(1977). Exploratory Data Analysis. New York: Addison Welsey.

~ We Are Not Afraid ~

The candle vigil at La Rambla and Catalunya.

One of the many candle-lit circles at la Rambla on the 20th paying tribute to the victims.

When I last wrote for this blog we were having a good time at “La Festa” – mild injuries notwithstanding.

This was, as we all know by now, rudely interrupted by the terrible event which took place on La Rambla on the 17th of August. Our thoughts, as the PRACE Summer of HPC team’s Barcelona division, go out to the victims of this vain act and to the great city to which I here venture to pay tribute by describing what is always glossed over – the day-to-day life in the aftermath of the attack.

The life before

Day-to-day life in Barcelona is perhaps not that different than in any other major city in Europe. Doubly true for scientists such as me and Aleksander since science is our daily bread, seasoned with culture and garnished with adventure here and there. This life is certainly a major break from the quietness and cleanliness of the small town of Tübingen, which I call my home!

Common crowd size at the fountain show at MNAC.

The normal size of the crowd at the fountain show in front of the MNAC.

On the whole, one goes to work, enjoys the time after working hours and perhaps complains of the heat here. Since the sun is relentless during the day life in this great city only truly starts after around 17:30, when the outside becomes bearable.

With thousands of tourists being off-loaded by cruise liners periodically and hundreds flying in, the city is mostly geared towards them – at least the city centre. Especially the old city, Ciutat Vella, is almost entirely taken over by tourists now. You can’t go 200 m without hitting a restaurant, ice cream parlour or a coffee shop.

Street performers and pedlars abound, too, in the tourist spots. Small LED launchers are, apparently, the hot item of this summer during the evening hours, closely followed by beer and water.

By the way – our favorite ice cream spot was just in front of Sta. Maria del Pi, a stone’s throw from the Liceu metro station on line 3.

Beware! English language coverage drops off rapidly with distance from the main touristic spots, and even there it is not exactly perfect. So some basic Spanish or, even better Catalan, is advisable when coming here. You can survive without, but it was quite a challenge for me to piece the meaning of the sentences from my patchy knowledge of French and Italian, with English as glue.

T + 0 days

Carrer d'Asturies on the 17th - people without a care in the world.

At 2300 on the 17th people are still milling around in Gracia – fewer than normal, though.

On that day, I decided, once again, on walking home from the BSC instead of taking the metro. Thus I was lucky to avoid being stuck in the metro near the place of action, seeing as our everyday transport – line 3 – passes straight under the fated boulevard. It was not until I was home at the Residencia Universitaria de Lesseps that I noticed the warning about the attack, sent to me by Aleksander.

Severe as the incident was, its influence was not immediately perceptible. That is the one positive thing one could say about this type of attack. Its potential for causing a mass panic in a city as large as Barcelona is rather low. Being just 3-ish km away from the place of action the attack was not perceptible.

The black ribbon at the Festa Major.

The festivities canceled for the day Gracia was quiet – with few still admiring the decorations.

That evening, as is my habit, I went to explore another part of Barcelona by night. I abandoned my original destination of visiting the Cathedral in the Ciutat Vella wandering instead through Gracia in the general direction of Pl. de les Glories Catalanes. The festivities of the Festa Major de Gracia were suspended that day and the following Friday. The stream of
people at midnight was smaller than it normally would have been, but the streets were far from being deserted.

T + 1 day

The morning after came around. Friday – the last day of work for the week. Leaving for the BSC, as was my custom, at around half past eight I found the metro to be a bit less crowded than it normally was. It did not halt at neither Catalunya, nor at Liceu – the terminal stop of the van the day before.

As the clock struck twelve all were suspended in a minute of silence for the victims of the attack.

By the time I was returning home at 1700 both stops were being served again and the metro was as full as ever, though definitely more solemn.

It is a tribute to the local people, that life returned to normal as fast as it did without any major “knee-jerk” reactions. I truly admire the people here for their measured response! Certainly, there was more police deployed throughout the city during our final week in Barcelona, but except for that, life was returning to normal by the evening of the day after.

T + 2 days

The Saturday came around and, after having done my shopping for the week,

Font Magica on the third day of mourning

The Font Magica de Montjuic was far from deserted on the third day of mourning. Even though no show was to be held.

I decided to visit Pl. Espanya again. The sky promised great opportunities for images. Late to leave, I had missed the sunset and was left to make do with dusk.

The steps before the Museo Nacional de les Arts Catalanes (MNAC) were full, though all official performances were suspended during the 3 days of mourning. There it was immediately obvious, that a terrible incident took place, since the crowd was quite a bit smaller than normal.

No fountain show was to be expected but apparently this did not reach the ears of many tourists, since a lot of those present clearly expected to be entertained. I pity the local police for having to answer the same question over and over again.

It is a silver lining on the horizon that the original plan of the group literally blew up in their faces and the attack carried out afterward was improvised. Had the attacker shown up just half an hour later, or even a day later, the number of victims may very well have been a lot higher, since – due to the weather – the tourist spots do not get well populated before 1700.

T > 4 days

Midnight revellers at La Festa during its final night.

Aleksander trying to revive his phone for pictures at the display of Fraternitat de Dalt during the final day of La Festa. Almost midnight and still a lot of visitors!

With the end of the official mourning period the city life definitely returned to normal. Entertainment and vigor were back on the menu  inviting any- and everybody to participate in the very lifestyle the terrorists were attempting to disrupt.


On the final Saturday in Barcelona, I decided to scout some souvenirs and was promptly swept up in the march against terror. That is where I have learned the few words in Catalan – the local dialect in Catalonia – which I shall never forget:

No tinc por – I am not afraid

True to this motto we have continued to pursue the completion of our projects in the little time that we still had in this great city. Nothing shall change the academics’ lifestyle – semester break is when you get work done!

As the PRACE Summer of HPC team’s Barcelona division we stand with this city and declare

No tenim por

Read more ›

1. Introduction

This summer I started to make my first steps towards the field of HPC. My participation to the SoHPC program sparked my curiosity about this field and I have become willing to learn more about the world’s most powerful supercomputers. The Top500 list has been an interesting source of information to learn about that. I enjoy going through the list and exploring the specifications of those extraordinary computers.

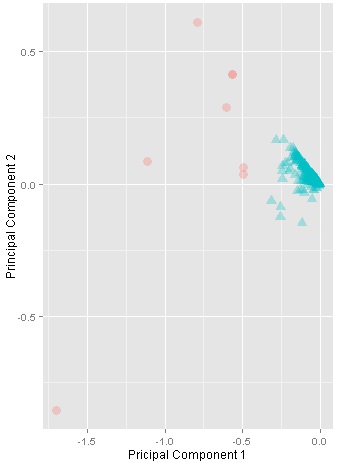
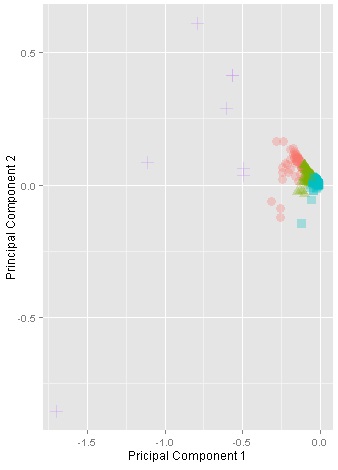
One idea that came across my mind was to apply Machine Learning (ML) to the Top500 list of supercomputers. With ML, we can learn and extract knowledge from data. I was particularly interested in applying clustering to investigate potential structures underlying the data. In other words, to check if the Top500 supercomputers can be categorised into groups (i.e. clusters) based on a mere data-driven perspective.

In this post, I present how I utilised ML clustering to achieve that goal. I believe that the discovered clusters may help explore of the Top500 list in a different way. The rest of the post elaborates on the development of the clustering model, and the cluster analysis conducted.

2. Questions of Interest

Truth be told, this work was initially started just to satisfy my curiosity. However, one of the qualities that I learned from doing research, is the importance of having questions upfront. Therefore, I always try to formulate what I endeavour to achieve in terms of well-defined questions. In this sense, below are the questions addressed by this piece of work:

  1. Is there a tendency of cluster formation underlying the Top500 list of supercomputers based on specific similarity measures (e.g. number of cores, memory capacity, Rmax, etc.)?
  2. If yes, how do such clusters vary with respect to computing capabilities (e.g. Rmax, Rpeak), or geographically (e.g. region, or country)?

3. Data Source

First of all, the data was collected from the Top500.org list as per the rankings of June 2017. The data was scraped using Python. With Python, web scraping is simplified using modules such as urllib and BeutifulSoup. The scraped dataset included 500 rows, whereas every row represented one data sample of a particular supercomputer. The dataset was stored as a CSV file. The Python script and dataset are accessible from my GitHub below:
https://github.com/Mahmoud-Elbattah/Data_Scraping_Top500.org

4. Clustering Approach

As described by (Jain, 2010), clustering algorithms can be divided into two main categories including: i) Hierarchical algorithms, and ii) Partitional algorithms. On one hand, the family of hierarchical algorithms attempts to build a hierarchy of clusters representing a nested grouping of objects and similarity level that change the grouping scope. In this way, clusters can be computed in an agglomerative (bottom-up) or a divisive (top-down) fashion. On the other hand, partitional algorithms decompose data into a set of disjoint clusters (Sammut, and Webb, 2011). Data is divided into K clusters satisfying that: i) Each cluster contains at least one point, and ii) Each point belongs to exactly one cluster.

In this piece of work, I used the partitional clustering approach using the K-Means algorithm. The K-Means algorithm is one of the simplest and most widely used clustering algorithms. The K-Means clustering uses a simple iterative technique to group points in a dataset into clusters that contain similar characteristics. Initially a (K) number is decided, which represents centroids (i.e. centre of a cluster). The algorithm iteratively places data points into clusters by minimising the within-cluster sum of squares as the equation below (Jain, 2010). The algorithm eventually converges on a solution when meeting one or more of these conditions: i) The cluster assignments no longer change, or ii) The specified number of iterations is completed.


Where μK is the mean of cluster Ck, and J(Ck) is the squared error between μK and the points in cluster Ck.

5. Feature Selection

The dataset initially contained a set of 13 variables (Table1), which can be considered as candidate features for training the clustering model. However, the K-Means algorithm works well with numeric features, where a distance metric (e.g. Euclidean distance) can be used for measuring similarity between data points. Fortunately, the Top500 list includes a number of numeric attributes such as number of cores, memory capacity, and Rmax/Rpeak. Other categorical variables (e.g. Rank, Name, Country, etc.) were not considered.

The model was trained using the following features: i) Cores, ii) Rmax, iii) Rpeak, iv)Power. Though being a numeric feature, the memory capacity had to be excluded since it contained a significant proportion (≈ 36%) of missing values.

Table 1: Variables explored as candidate features.

Variables 
Rank Name
City Country
Region Manufacturer
Segment OS
Cores Memory Capacity
Rmax Rpeak
Power

6. Pre-processing: Feature Scaling

Feature scaling is a central pre-processing step in ML in case that the range of feature values varies widely. In this regard, the features of the dataset were rescaled to constrain dataset values to a standard range. The min-max normalisation method was used, and every feature was linearly rescaled to the [0, 1] interval. The values were transformed using the formula below:

7. Clustering Experiments

The unavoidable question while approaching a clustering task is how many clusters (K) exist? In this regard, the clustering model was trained using K ranging from 2 to 7. Initially, the quality of clusters was examined based on the within cluster sum of squares (WSS), as plotted in Figure 1. Figure 1 is commonly named as the “elbow method”, as it obviously looks like an elbow. Based on the elbow figure, we can choose the number of clusters so that adding another cluster does not give much better modeling of the data. In our case, we can learn that the quality of clusters started to level off when K=3 or 4. In view of that, it can be decided that three or four clusters can best separate the dataset into well-detached cohorts. Table 2 presents the parameters used within the clustering experiments.

Figure 14: Plotting the sum of squared distances within clusters.

Figure 1: Plotting the sum of squared distances within clusters.

Table 2: Parameters used within the K-Means algorithm.

Parameter Value
Number of Clusters  (K) 2–7
Centroid Initialisation Random
Similarity Metric Euclidian Distance
Number of Iterations 100

To provide a further visual explanation, the clusters were projected into two dimensions using the Principal Component Analysis (PCA), as in Figure 2. Each sub-figure in Figure 2 represents the output of a single clustering experiment using a different number of clusters (K). Initially with K=2, the output indicated a promising tendency of clusters, where the data space is obviously separated into two big clusters. Similarly for K=3, and K=4, the clusters are still well-separated. However, the clusters started to be less coherent when K=5. Thus, it was eventually decided to choose K=4.

The clustering experiments were conducted using the Azure ML Studio, which provides a flexibly scalable cloud-based environment for ML. Furthermore, the Azure ML Studio supports Python and R scripting as well. The cluster visualisations were produced using R-scripts with the ggplot package (Wickham 2009).

K=2

K=3

K=4

K=5

Figure 2: Visualisation of clusters with K ranging from 2 to 5. The clusters are projected based on the principal components.

8. Exploring Clusters

Now let’s explore the clusters in an attempt to reveal interesting correlations or insights. First, Figure 3 shows the proportions of data points (i.e. supercomputers) within every cluster. It is obvious that there is a pronounced variation. For example, Cluster3 contains more than 60% of the Top500 list, while Cluster4 represents only about 2%.

Figure 3: The percentages of data points within clusters.

Figure 4 and Figure 5 plot the number of cores and Rmax against the four clusters respectively. It can be noticed that Cluster4 included the most powerful supercomputers in this regard. It also interesting to spot that “flying-away“ outlier, which represents the supercomputer ranked #1, located at the National Supercomputing Center in Wuxi, China. This gap clearly shows how that supercomputer is significantly superior to the whole dataset.

Figure 4: The variation of the number of cores variable within the four clusters of supercomputers.

Figure 5: The variation of the Rmax values within the four clusters of supercomputers.

Now, let’s learn more about Cluster4 that obviously represents the category of most powerful supercomputers. Figure 6 plots the segments (e.g. research, government, etc.) associated with Cluster4 supercomputers. The research-oriented segment clearly dominates that cluster.

Furthermore, Figure 6 shows how this cluster is geographically distributed worldwide. It is interesting that the Cluster4 supercomputers are only located in China, Japan, and US. You may be wondering: why the Piz Daint supercomputer (ranked #3) was not included in Cluster4? When I went back to the Top500 list, I found out that the Piz Daint actually has fewer cores than other lower ranked supercomputers in the list. For instance, the Sequoia supercomputer (ranked #5) has more than 1.5M cores compared to about 360K cores of the Piz Daint. However, the Piz Daint has higher Rmax and Rpeak. I am not aware of the process of evaluating and ranking supercomputers, but the noteworthy point to mention here is that this grouping was purely predicated on a data-driven perspective, and considering the expert’s viewpoint should add further concerns.

Figure 6: The variation of segments within Cluster4.

Figure 7: The geographic distribution of Cluster4 supercomputers.

9. Closing Thought

Data clustering is an effective method for exploring data without making any prior assumptions. I believe that the Top500 list can be viewed differently with the suggested clusters. Exploring the clusters themselves can raise further interesting questions. This post is just the kick-off for further interesting ML or visualisation work. For this reason, I have made the experiment accessible through the Azure ML studio via:
https://gallery.cortanaintelligence.com/Experiment/Top500-Supercomputers-Clustering

References

Jain, A. K. (2010). Data Clustering: 50 Years beyond K-means. Pattern recognition letters, 31(8), 651-666.
Sammut, C., & Webb, G. I. (Eds.). (2011). Encyclopedia of Machine Learning. Springer Science & Business Media.
Wickham, H., 2009. ggplot2: Elegant Graphics for Data Dnalysis. Springer Science & Business Media.

Follow by Email