Cheers to the wee Visualization of a Well-Log correlation!

Greetings from Edinburgh 🙂
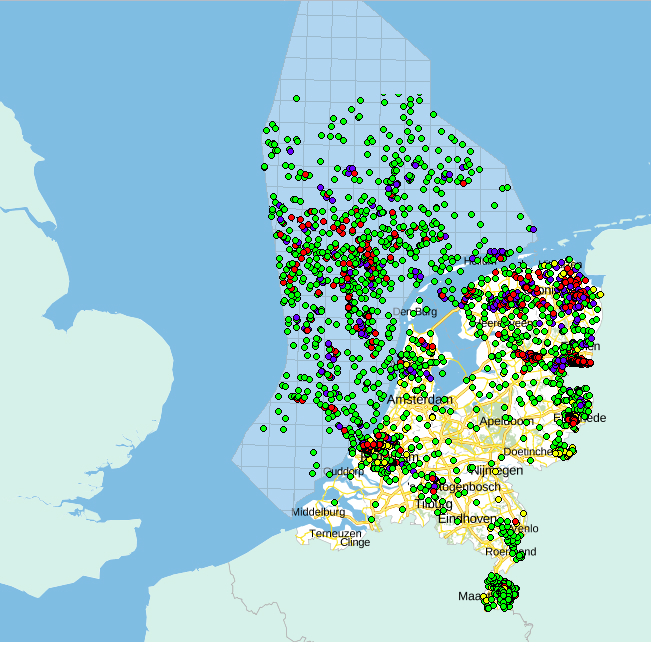
Borehole Map at the North Sea shelf
During the past few weeks I have been able to finalize the project task that I have been assigned and I am very very excited for that. In a nutshell, a Python based code was developed for the pre-processing of real well-log data. The borehole data that I have been using and testing comes from the Netherlands and Dutch sector from the North Sea continental self. The developed utilities now include: Data extraction based on specific geologic parameters such as Gamma Ray, Porosity or Density measurements, Plotting with interpolation features and Data storage in various formats or binary form.
Another feature, which is actually the core of my summer project, was the merging of a large number of different well-log data into one file, with formatting suitable for the Data entry to a cool code!! This cool code that I am referring to, is a newly developed Well-Log correlation method that is included in The Mines Java Toolkit repository. The process of generating real case studies for Well-Log correlation was facilitated with this attempt and I was able to visualize the results. Well-log correlation looks something like the graph below, with the colourbar included in the essentials!!
Tools for Geologic interpretation: “13 density well-logs correlated based on relative geologic time in a color-coded manner”
Now it is up to experienced geologists to evaluate this “Simultaneous Well-Log correlation method” and discuss its limitations and accuracy. In the past, well-log correlation was conducted solely by geologists and required many man-hours for an accurate geologic interpretation to be complete. Nowadays ,the development of autonomous well-log correlation methods enables that in just a few seconds. But beware 🙂 every method should be thoroughly tested before put into industrial use.
Future research includes machine-learning methods and deep convolution networks for solving the exact same problem. Is this possible you may ask?
Oh well 🙂 , methods that facilitate geologic interpretation, and to be more specific the problem of Facies classification that I mentioned in my previous blog posts, have already been developed. The results are promising too. Despite that, literature reviews and open source material in this research area shows that inadequate realistic case studies are mostly responsible for the poor performance and accuracy of results. That is the main reason why my project was focused on the generation of real well-log correlation examples. You can check out my video presentation in YouTube if you want, and all the material on my GitHub profile for a more detailed documentation.
 Last but not least, as my whole coding journey through the libraries of NumPy, Scikit-learn, Pandas, Matplotlib and many more comes to and end, I am grateful for the amazing learning experience PRACE’s Summer of HPC proved to be. I would also like to add that it was accompanied by many cups of the finest Scottish tea, shortbread treats and exciting weekend trips around Edinburgh.
After all these adventures I am a wee engineer/programmer now :). And remember, if someone tells you that having a vacation while learning and being productive is not possible, prove them wrong. 🙂
