Getting around CINECA – The beginning of web visualization.
“It was a warm summer evening in Ancient Greece…”
says Sheldon Cooper when trying to teach some Physics to Penny. My story for the next two months, which I am going to explain in this blog, starts in a similar way…
It was a hot summer afternoon in Bologna airport. The plane had just landed and my SoHPC mate, Petr, and I were going to the apartment where we will be spending the next two months. It was tough at first, after a week of training with all the SoHPC students and 25ºC weather in Ostrava, to get used to Bologna’s 35ºC weather. Also there were just two of us, since everyone is now scattered around Europe. We had some time to enjoy the beautiful city of Bologna and start our summer diet of pasta and pizza. However, we were really looking forward to meet the people from CINECA and getting started with our projects. In conclusion, my summer story had just begun.
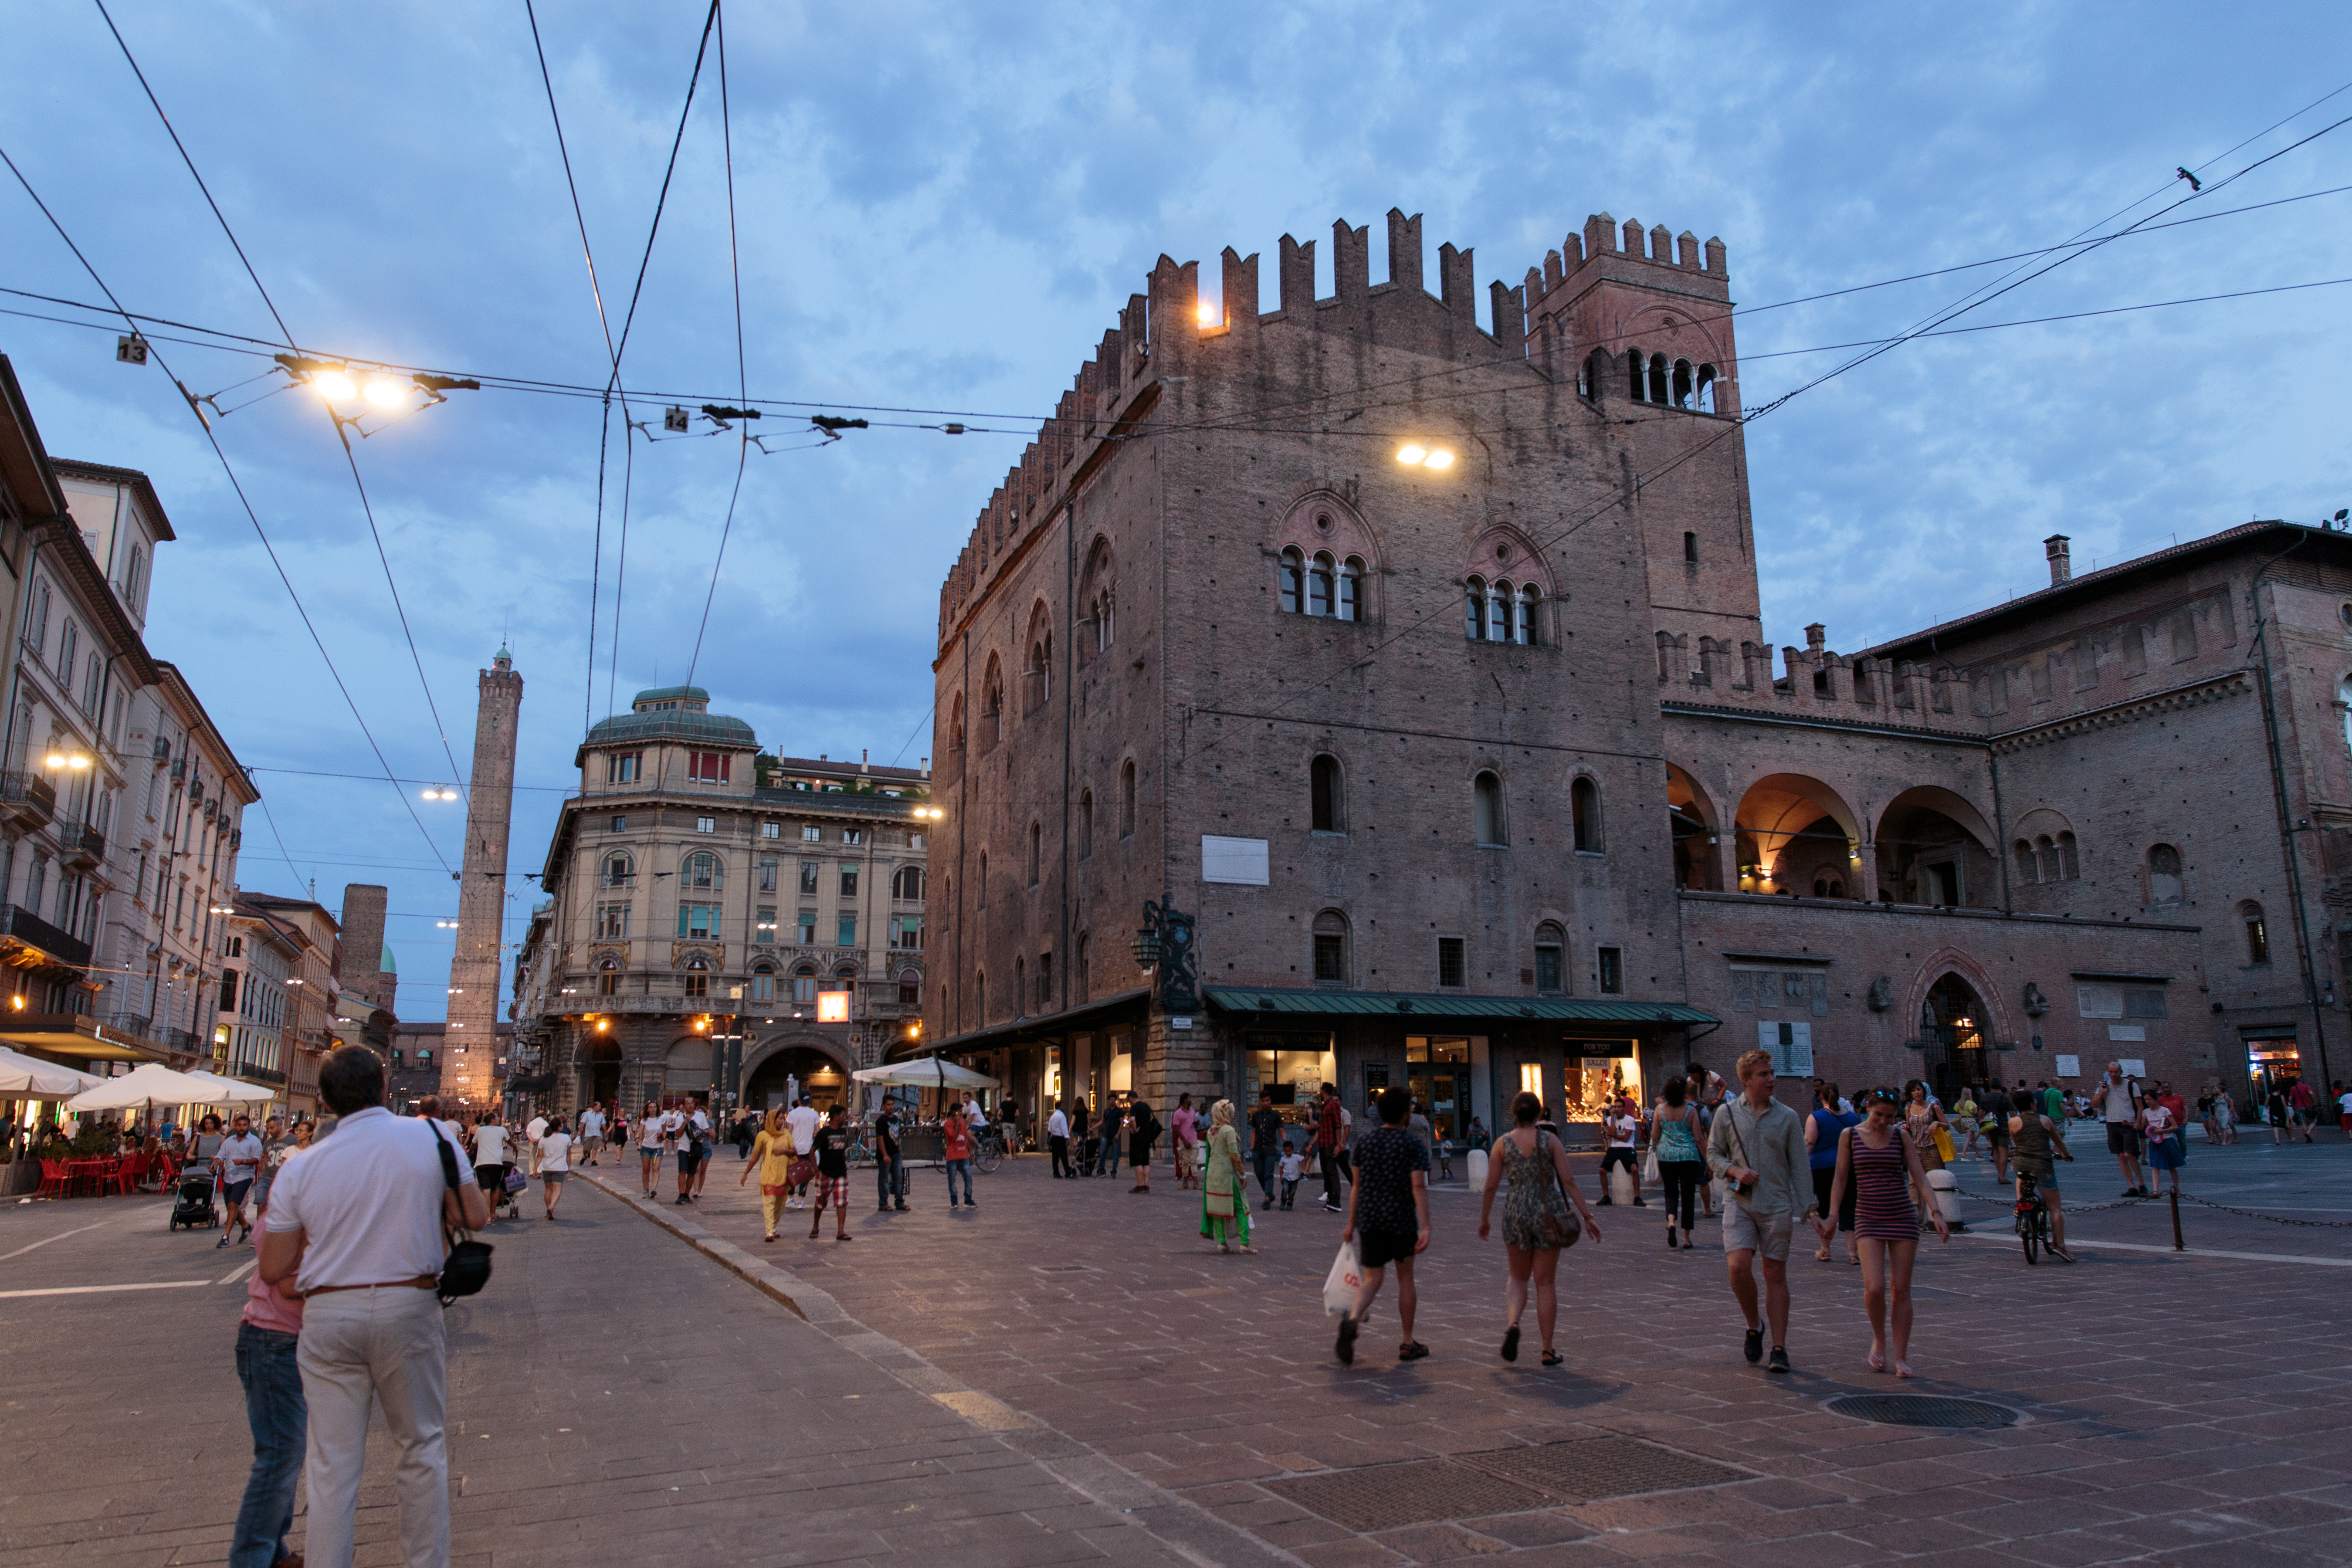
A typical evening at the center of Bologna.
I could write about Bologna and my stories here for the whole post, but that’s not what I want to present to you today. In this post, I want to introduce you to my SoHPC project which I will be working on during the summer. In my first self-introductory post I mentioned that I am working on the project “Web visualization of the Mediterranean sea”. But, why do we need a web visualization of the Mediterranean sea? What scientific use does it have? Well, this is what I’m going to explain in this post.
The Instituto Nazionale di Oceanografia e di Geofisica Sperimentale (OGS) is one of the parties involved in the European Copernicus Marine Environment Monitoring Services. Using their OGSTM-BFM (OGS Tracer Model – Biogeochemical Flux Model) code, they are able to perform simulations to study the major biogeochemical properties in marine ecosystems, with a special focus on the Mediterranean Sea. Generally, these simulations can be performed for:
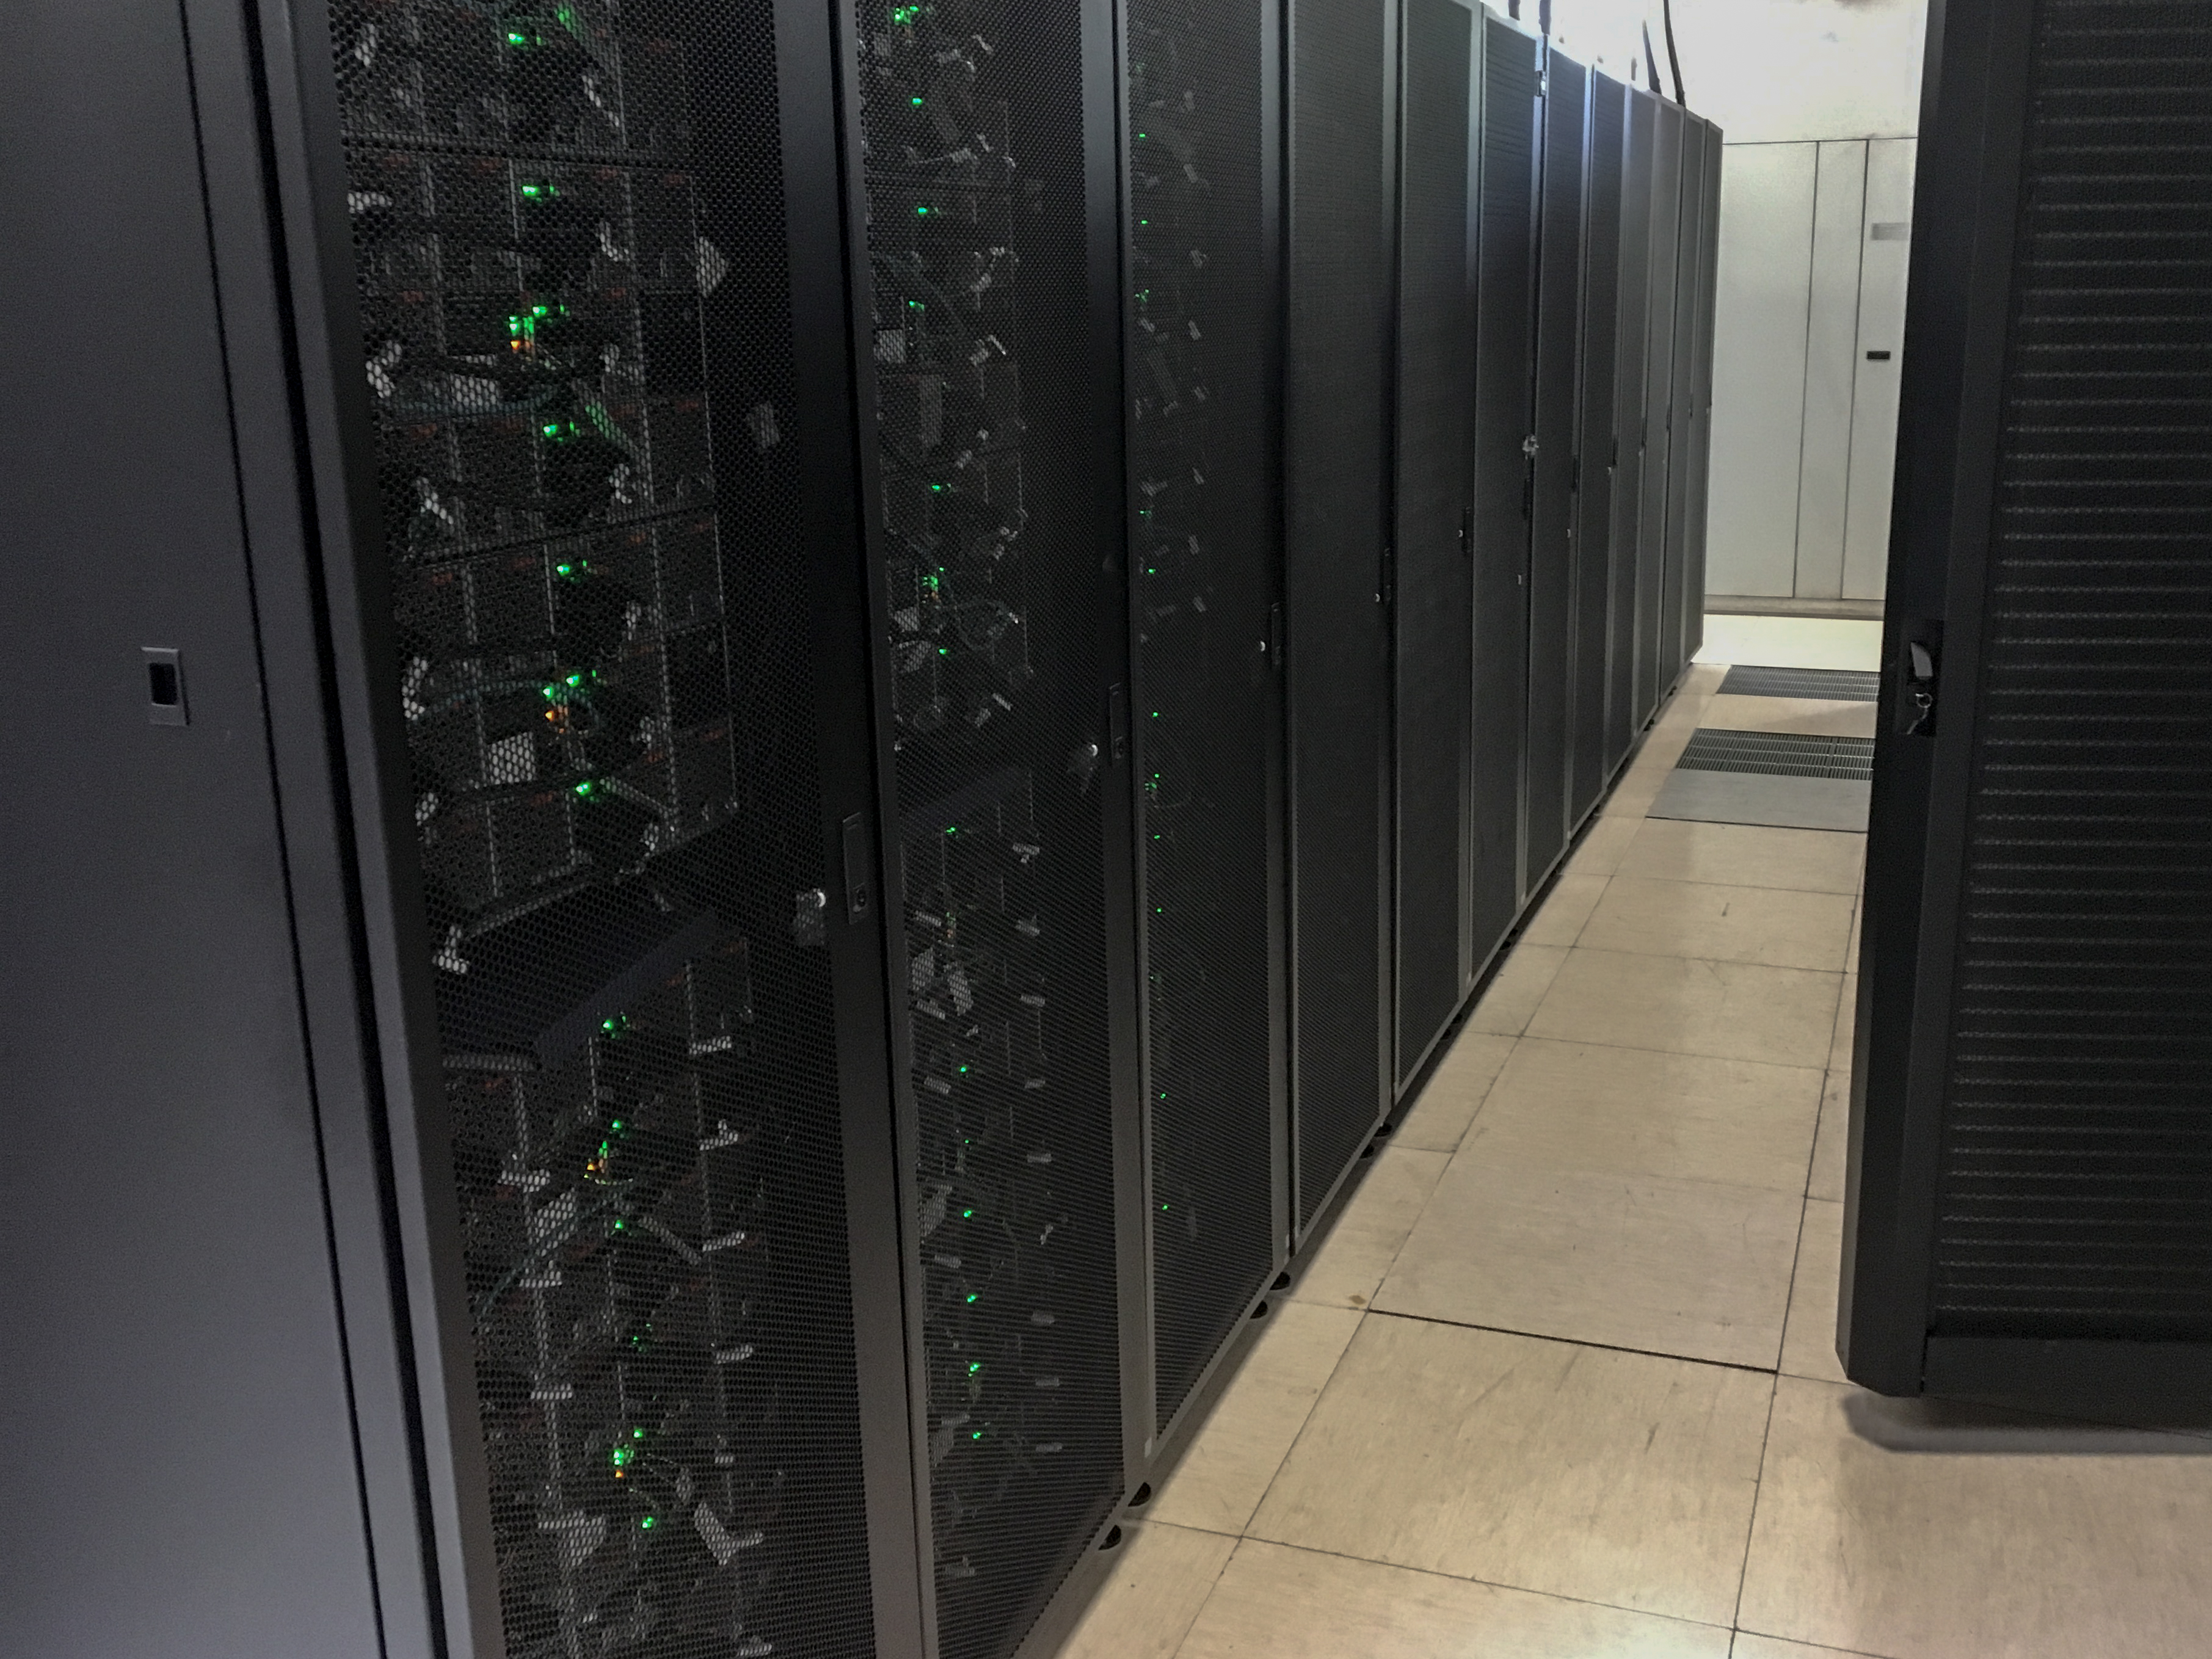
CINECA’s supercomputer racks, photo taken during the visit to CINECA’s supercomputer facilities.
- Short time biochemical forecasts that cover around 20 days and are run twice a week in one of CINECA’s supercomputers: Pico. Their inputs, also called “forcings”, come from other Copernicus’ partners, building a very complex network.
- Climate studies that project up to 100 years into the future. In this case, surface satellite colour data can be assimilated with the model, both to improve the forecast skill and to produce optimal representations of the last decades biogeochemical state of the Sea.
Quite impressive, isn’t it?
So, what is my role then? Concerning numerical simulations, we can usually distinguish three main parts: pre-processing and set-up, running the model and post-processing the results. As you might have guessed, the OGSTM-BFM code generates large amounts of data. However, raw data are of little use generally. We need to post-process this data set and convert it to something that can be easily understood, for example graphs or maps. One of the problems OGS has in this subject is precisely how to optimally visualize the 3D data.
Chlorophyll concentration on the Mediterranean Sea. Post-processed in VTK using python, exported to ParaView and animated with Blender. Credits: “Generated with E.U. Copernicus Marine Service Information”
Tools such as Paraview and Blender can produce 3D visualizations and videos that can be easily understood. The philosophy behind these is: “an image is worth a hundred words”. Recently, these programs (Paraview in my case) have developed web-based viewers that can connect to and access the computers where the data set is stored. Then, 3D visualizations, maps, vertical sections or any kind of graphs that can extract information from the data set selected will appear in a browser. In a nutshell, as my SoHPC supervisor, Dr. Paolo Lazzari mentioned:
“We need an efficient way to explore the data.”
So, this is what I will be doing this summer, besides eating pizza and pasta. Stay tuned here to learn more about my project and follow my story!
Credits: “E.U. Copernicus Marine Service Information”
