Working with Climate Data

Greetings from the Irish Centre of High-End Computing (ICHEC) in Galway, Ireland. I have settled down, learned the basics of what I need for my project and started working on it. My project involves processing and visualization of climate data and I thought it would be interesting to share some of my experience with you.
What are climate Data?
Climate data are in fact huge sets of data regarding a specific state of the atmosphere. Included are measurements of temperature, precipitation, wind speed and power, humidity and many more. Some of these data are quite easy to record (ground sensors), but some are quite hard (weather balloons that fly high in the air and measure air pressure, temperature and so on, or even buoys that measure ocean data).
Data Processing
All of these data are then processed in common formats the community has agreed upon, so that all of the people involved can speak quite the same “language”.
One of these common formats, which I will be working with is the Network Common Data Format (NetCDF) . A simple NetCDF file has a header with metadata describing the actual data, followed by the data itself. One powerful feature of NetCDF is that the files are self-describing, meaning that no other files are needed to explain the data included. An example of a NetCDF file can be found here ( you have to convert it to ASCII in order to read it – use ncdump).
After creating the NetCDF files there is a huge variety of tools for manipulating them. I am using a tool called CDO (Climate Data Operators), a command-line tool that is easy and straightforward. For example, lets say you have two datasets, one including all of the mean temperatures over Ireland for the past 20 years and one including the same data for the future 20 years (simulated). Then you can easily create a new dataset including the temperature change by simply typing:
cdo sub future.nc past.nc change.nc
Visualization
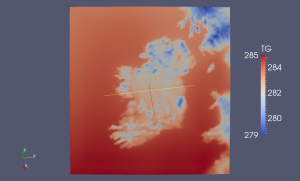
The problem with climate data is that, like in every big-data application, the amount of data itself is huge. Thus, in order to make conclusions from the Data Processing we sometimes have to visualize them. Visualization is also a great way of explaining your work to non-experts of the field. For the Visualization part I am using Paraview which can natively read NetCDF files. To carry out repetitive tasks in Paraview I am also using Python’s interface to it. If for example it is needed to apply the same filter over 100 datasets I could just write a python script to do that. There is a small Visualization cluster in ICHEC which will be processing and rendering the data in parallel and I will be using my workstation as a client to view the data and create the animations I need.
Problems never end…
All of the above mentioned it would be great if we had infinite storage in our machines!! Modern climate models produce more than 30 TB/day of climate data. So it is impossible to download them for visualization. Modern techniques request the data directly from storage and process them on the fly. There is a protocol called OpenDAP used for this purpose. So there are OpenDAP servers containing the data so that clients can request all or subsets of the data they need in the form of a URL. For example you can select a subset of the 3D array “sst” with:
http://some_opendap_server/data/nc/sst.mnmean.nc.gz.asc?sst[0:1][13:16][103:105]
So the researchers in ICHEC have created a plugin for Paraview that enables it to read OpenDAP URLs as if they were NetCDF files. I will be testing and scaling this plugin to use multiple connections between the nodes of the visualization cluster and the OPeNDAP server.
More to come soon!!


Thanks Toni!
I guess we’ll start sharing more once our simulation software becomes operational.