First glimpse of the data
Over the past year or so, I’ve gotten quite used to loading .dat files of row data into matlab for visualisation. In matlab it’s easy, just type “load(‘filename’)” into the command line (or matlab script) and matlab returns an array that can be broken up and manipulated in whatever way is required.
In Paraview, this is somewhat less straight forward. Our data (the result of an MHD simulation of turbulent plasma) came in the form of a .dat file with rows of data, each containing six floating point numbers representing the components of the electric and magnetic fields at a particular point on a 128x128x128 grid. Our first instinct was to rename the files from .dat to .csv and read them directly into Paraview in the form of a spreadsheet from which the data could be extracted.
This almost works, but is extremely tedious.
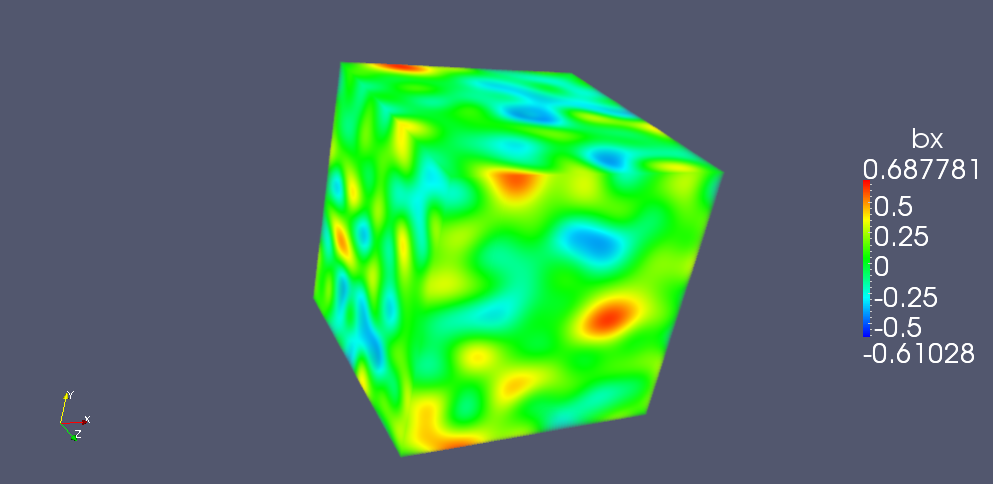
It seemed like a better solution would be to convert the files into a format that Paraview could instantly understand. Writing VTK files is not something I have had previous experience of but, it turns out, it is a reasonably simple (i.e. hours rather than weeks) thing to learn. The resulting VTK file could then be read directly into paraview and visualised, as shown below.
Paraview visualisation of an MHD simulation of turbulent plasma
Admittedly, this is almost identical to the shot used in the project description and, yes, our project co-ordinators could have explained all of this to us from the start but it always feels good to figure something out for yourself, especially when it comes to the fundamentals.
