Introduction to ParaView Catalyst

In my previous article you can find a brief introduction to the In Situ Visualization Technique which allows to explore simulation data during the run-time without involving storage resources of a supercomputer. Now it’s time to go a little bit further and focus on how to integrate in situ analysis capabilities with your own code. In this article I would like to show you what does it take and whether it is worth to put an effort into it.
Recently, there has already been done a significant work in the development of several in situ solutions that can be directly embedded into the simulation code, so there is no need to rewrite it from scratch. Here I will look closer on ParaView, a popular multi-platform scientific data analysis and visualization environment which is distributed under an open source license. While demonstrating its qualities in post-processing of extremely large datasets for a long time, thanks to Catalyst library ParaView now also belongs among currently available in situ visualization tools.
Catalyst, a relatively new component of ParaView, has been designed for fast integration with numerical codes and performing real-time analysis of generated data. It changes the traditional three-step simulation workflow. Here you first specify, which data you would like to see and analyse in situ. For this reason Catalyst uses a pipelines that are executed during the initial phase of the numerical simulation. In these pipelines, you can utilize all the post-processing capabilities which ParaView offers. In other words, you select the data which simulation produce, then apply filters such as slices, streamlines or iso-surfaces and finally choose what should be dumped for deeper investigation. This way, the output can be significantly reduced because the processed elements, which carry all the information you are interested in, are much smaller than the full datasets.
Since ParaView is built on the standard visualization toolkit VTK, the simulation internal data structures have to be transferred into the VTK data structures. This is done via so called adaptors. Adaptor is a simulation interface, which should be separated from the code, in order not to disturb it and simplify build process. At the end of the day, you have to call only three functions of the adaptor from the original code. The first one, which is called only once per simulation run, initializes Catalyst and loads pre-configured pipelines. The second one creates VTK grids, appends the computed attributes on it and dumps selected elements with frequency specified by the user. And the last function is used at the end of the simulation to release all Catalyst resources.

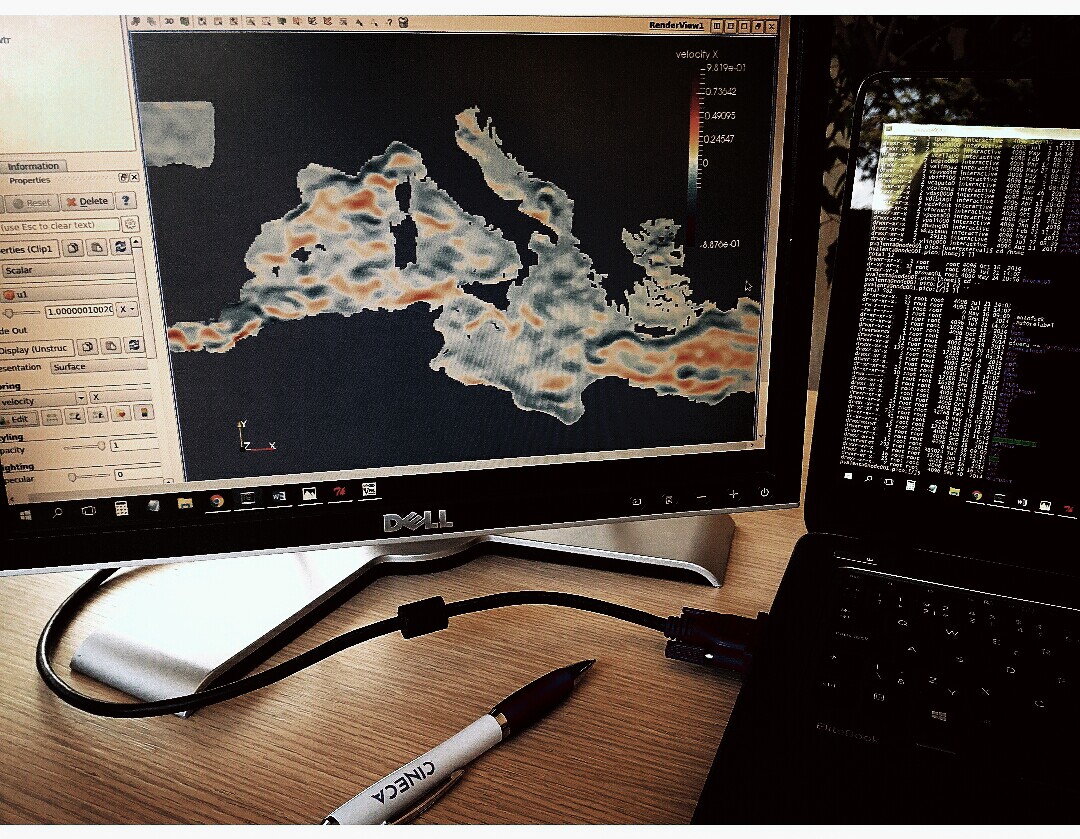
Example of simulation connected to Catalyst. In the top-left window you can see the Catalyst sources and the datasets that are extracted to the server. Real-time results are then visualised in the main window.
Once you finish the procedure specified above and instrument your code with Catalyst, it is time to run the simulation. First you should run pvserver, a component which represents the server on which ParaView is running and process all the data. Then you can connect to that server with ParaView client and control the visualization remotely from your local machine or using visualization nodes of a supercomputer. The main advantage of doing this is that pvserver can be executed in parallel, so with enough resources you can smoothly explore even extremely large datasets. Via ParaView client you can then connect to Catalyst with port number specified in the pipelines. Once you are connected, the pvserver waits for the simulation data. The last step is to execute the simulation. Notice that the order is not important, there is no problem of connecting to already running jobs.
During the simulation, user can see the size of the datasets that simulation produces. But by default, none of the data is available on the server. The computationally expensive operations are done only on user’s demand via ParaView graphical interface. So the user can select data structures and analyse them the same way as via post-processing. But there is one difference: the simulation is running so user can observe the data as it is being generated. With Catalyst, it is also possible to pause the simulation or specify a break-point at selected time step. This can be helpful if you expect some interesting behaviour of investigated phenomena or for identifying of regions, where the numerical instability arises.
In summary, ParaView Catalyst is easy to integrate with already existing simulation code and offers really deep insight into the large amount of data corresponding to the simulated phenomena. If your code spends too much time for dumping generated data or if you contend with insufficient storage resources, ParaView Catalyst could be an elegant solution. In addition, in situ visualization is expected to enable a wide range of new interactive applications in future.
