Validating FEP for drug development
The cost of drug discovery
Last May I had the opportunity to attend VivaTech, an innovation fair, which takes place in Paris. There, Vasant Narasimhan, Novartis CEO, shared some thoughts about the present and future of pharma and biotech companies. During his talk, he insisted on the need of using computational tools in drug discovery. That is so because, according to Vasant numbers, the cost of drug development is now way above US$ 1 billion, thus the extremely high cost of producing new drugs is an urgent problem that needs to be tackled. Indeed, there are even studies that estimate this cost in more than US$ 2.8 billion, but with the use of computational chemistry the time and cost of the drug development process can be significantly reduced.

Drug discovery phases
Drug discovery has several phases. For simplicity, we may summarize them into four: discovery of an active compound, called “lead”; optimization of the lead, in which candidates are synthesized and characterized in preclinical studies to test safety and efficacy in animals; clinical trials to test for drug safety and efficacy in humans; and drug launching. The second phase, “lead optimization” may account for almost 25% of the total cost of all four phases, according to a study from 2010. Lead optimization includes optimizing drug metabolism, pharmacokinetic properties, bioavailability, toxicity, and of course efficacy. Drug efficacy is directly dependent on the binding affinity of the candidate drug onto the pharmaceutical target, which is commonly a protein. Optimizing the binding affinity, i.e. the strength of interaction of the candidate drug onto the protein of interest is the step we would like to optimize this summer.
Free Energy Perturbations
For pursuing this goal we are working at the Biomedical Research Foundation Academy of Athens on Free Energy Perturbation (FEP) simulations. FEP simulations determine the relative binding affinity of two drug candidates to discovery which one of the two binds more strongly onto the protein of interest. In the last post, we explained how with FEP simulations, we can compare the binding of two ligands to their target protein and determine which one is favored. As it was explained, this results from calculating a physicochemical property called “free energy of binding”, which directly relates to the binding affinity of the ligand-protein interaction. The difference in the free energy (ΔG) of binding of the two ligands is computed from Zwanzig’s equation, which takes into account the difference between the Hamiltonians – the potential and kinetic energies- of the two molecules in solution environment and in the environment of the protein. Using a thermodynamic cycle what we calculate is the difference in the free energy of binding (ΔΔG = ΔGΑ – ΔGΒ) between ligand A bound to the protein and ligand A solution (ΔGΑ) and ligand B bound to the protein and ligand B solution (ΔGB).
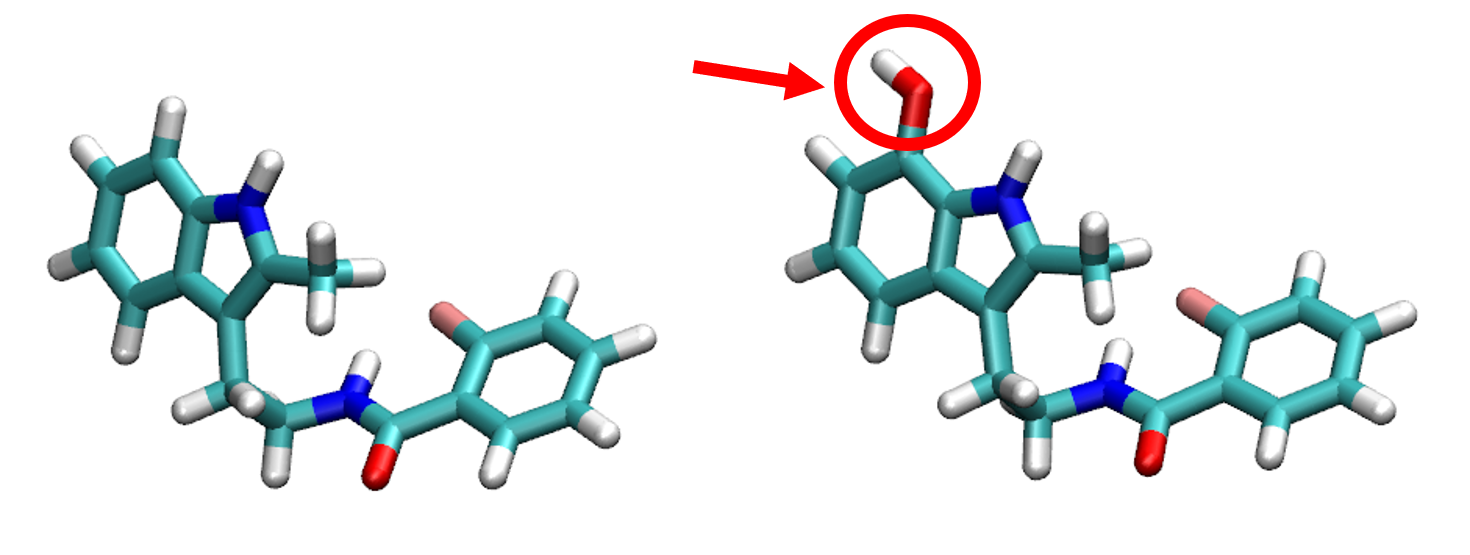
FEP computations are computationally expensive so they need to be carried out at High Performance systems, such as ARIS, the supercomputer administered by GRNET. The last simulation I ran on ARIS took around 14 hours and the usage of 80 computing nodes, each one with 20 cores of 2.8GHz each, to complete. That simulation was just comparing the lead molecule A with lead molecule B in which we had just substituted one hydrogen atom by a hydroxyl group (OH). The result was that lead molecule B had a negative free energy of binding compared to lead molecule A. Thus, we conclude that lead molecule B with the hydroxyl group is favored for binding to the protein of interest
In addition to high computational needs, FEP simulations still need to be validated as a tool for drug development. This is key and the goal of our project. We are comparing FEP simulation results using different force fields and software tools with the results obtained in experiments. In particular, I am using GROMACS software, and GAFF2 force field. At the end of the day, we will be able to tell how well FEP predicts the experimental results. If the correlation between calculated and experimental results is high, in the future FEP may save time and resources in the lead optimization process of drug discovery.
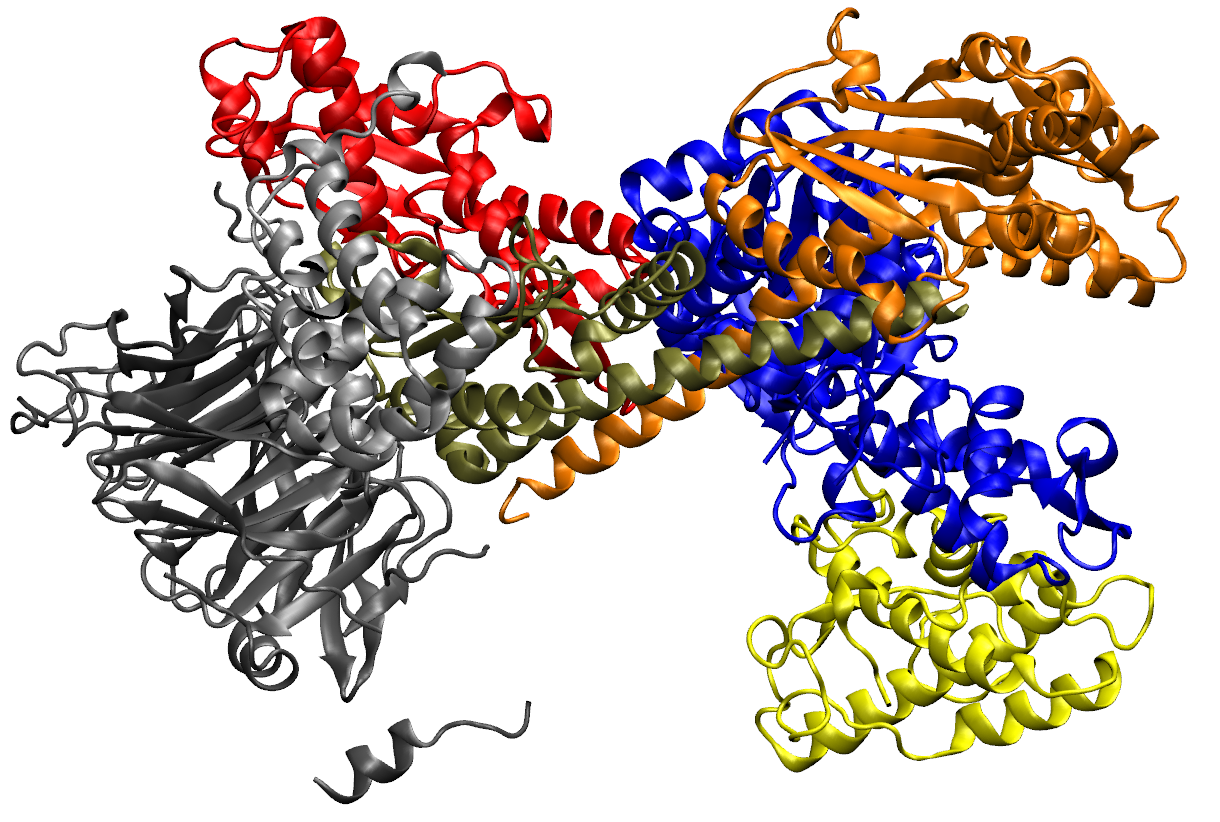
To compare FEP simulation results with lab experiments, we have decided to use a series of Arp2/3 inhibitors. Arp2/3, means “Actin-related protein 2/3” and it is a very important protein in our cells. It is part of the machinery that makes the cell move. However, in some scenarios we want to slow it down, since it is relevant in tumor motility. And that is what CK666 does. It inhibits Arp23 by binding to it. A collaborator group has obtained experimental results for the binding of CK666 and different analogs, which we will compare to our simulated results.
Goodbye
As it may have been clear from the above paragraphs, the whole project is a huge challenge for a biomedical engineer like me. Since I am not a chemist, I have to indulge in chemical principles. And since I am not a computer scientist, I have to learn to operate new software plus a supercomputer! Luckily, I am working with great colleagues who have been helping me enormously. And of course, as Jack Torrance may say, all work and no play makes Jack a dull boy, so after-work dinners and walks with friends are also a great source of help 😉