Dare to visualize – Tornado effect
Sometimes in life we have to accept dares, challenges or we even have to make self commitments to achieve success. By the way, this is human nature, after reaching one milestone we look to the next, and according to me:
Being unstoppable and having right attitude are the initial steps towards success
I’ve spent one month and 3 days, playing with ParaView Catalyst examples and trying to understand FORTRAN simulation code (given by my project coordinator), but this was the time to accept the “Dare to visualize Tornado Effect”. It’s onerous as well as interesting to understand someone else code (specially 1800 lines code) which leads you in the world of conundrums, but on the other hand you feel like Sherlock Holmes solving riddles.
The Crazy Code Conundrum
The code was using a 2D X-pencil Decomposition and Fast Fourier Transform library for dividing the 3D domain (cuboid box with dimensions 20X20X110) between the number of cores and it was used in a different way. The domain of double size was used for scientific calculations. So the first puzzle was to understand which part of the domain has the data to visualise. After brainstorming with Sandro Frigio (my project coordinator) on Skype we came to the conclusion that the data is in the first part of the domain. Then, I again checked the code and marked the places where I can make changes, to put an adapter function (the backbone for InSitu visualization) and parameters which I had to visualise. I sorted the parameters and did some adjusting in the code and it was ready for visualisation. That’s how I fixed the code puzzle.
Trying to fix the code !!!
The Bright Side of Visualisation
The dark night – wrong one
It was the time of visualisation and guess what happened. As usual guys;
The bright side always shows up after seeing the dark night
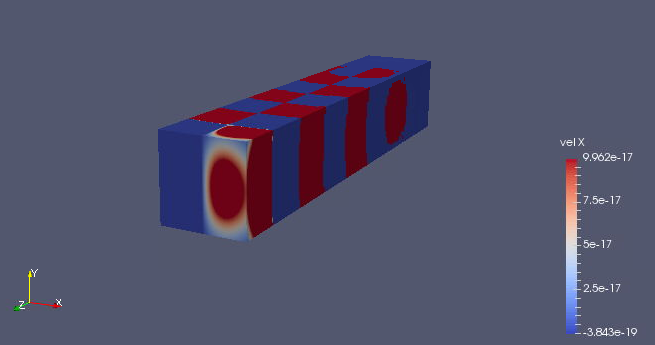
When I ran the simulation code with the ParaView catalyst I saw something colorful in my black and white life. But, when I discussed with Sandro Frigio, the result was wrong. I checked everything again and again but still the result was same. Then I added some filter options in ParaView like calculator, clip, slice, and many others. In the end I saw something which looks different and seems to me correct.
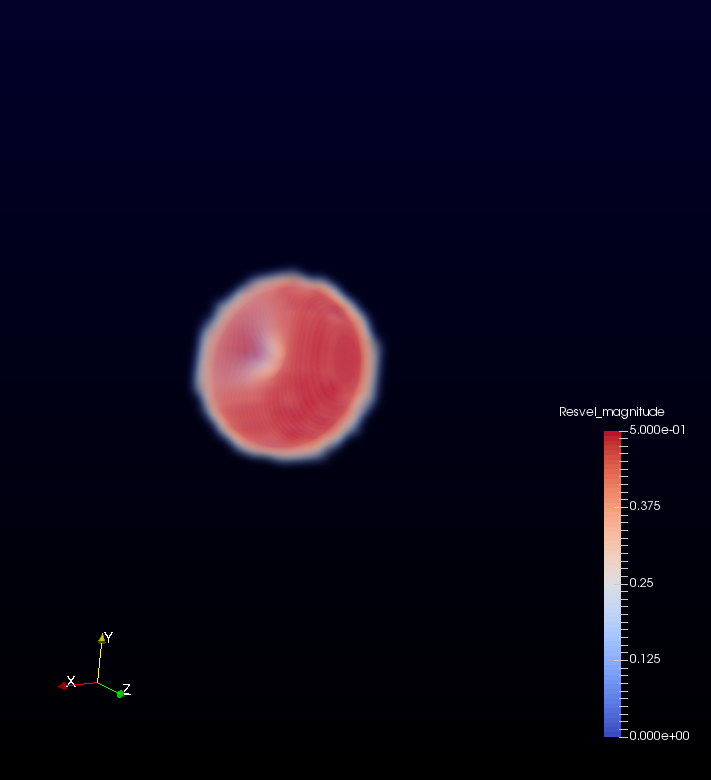
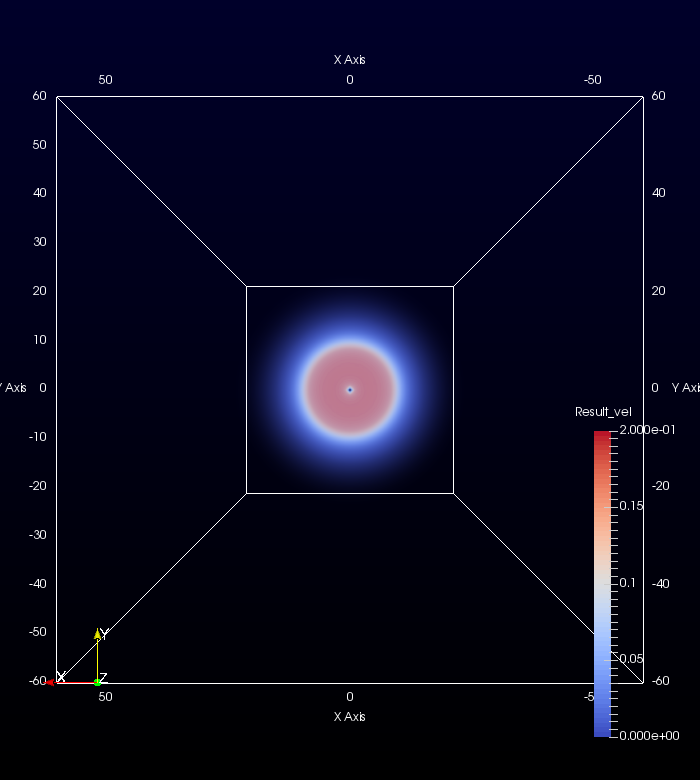
The bright side – glowing Donut
It was the glowing Donut. By which I mean the FFT velocity field values near the Gaussian center (something technical).But still I was thinking it might be wrong. Luckily the day was mine and my project coordinator was happy with the Donut. The complete velocity field could only be observed if we use greater domain size. At the same time we are worried about the problem of ParaView Catalyst while dealing with a rectilinear grid without using filters like clip, slice etc. I discussed this with my colleagues over lunch and we came to the conclusion that its a minor bug with ParaView which we can be neglected.
Story about working with big domain size and facing problems.
To Be Continued……
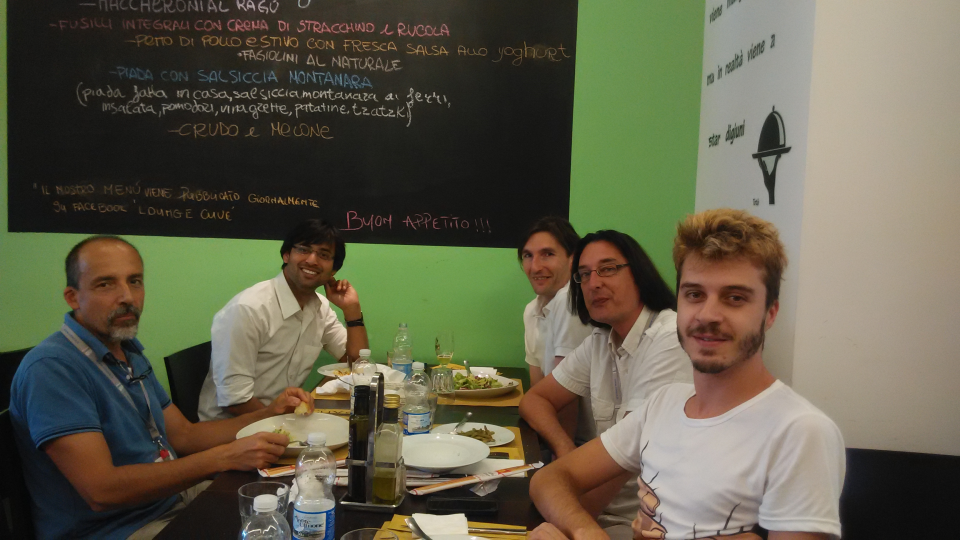
The Lunch time …
The Chill Out Time
Friday was great, I got the correct result and was hoping to see good results with big domain size. Now its time to chill out. Petr and I visited Bologna exploring the night life,we enjoyed live music in Piazza Maggiore. Then we discovered an awesome Irish Pub, as one of my favorites and we chilled out whole night there drinking chilled Guinness and Italian beers.
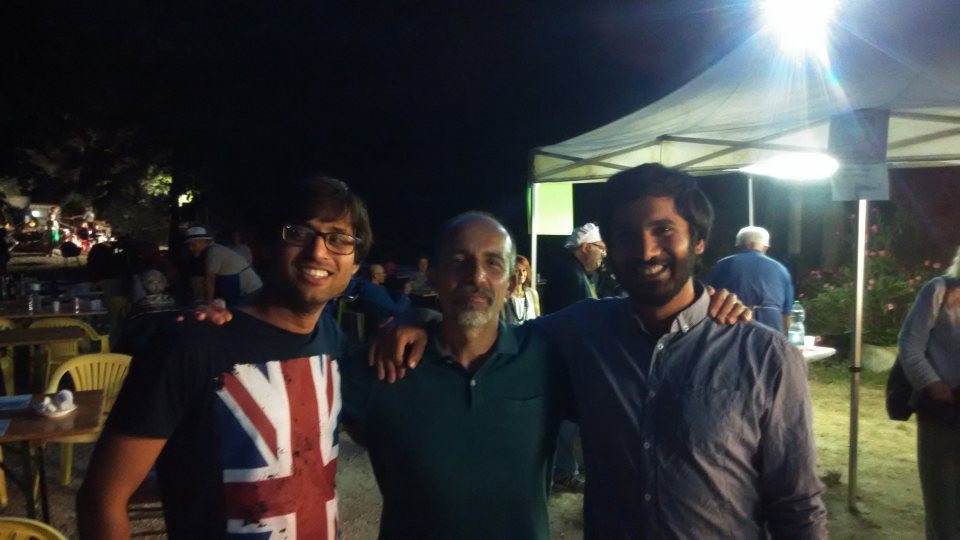
Enjoying Fest with Lugi Calori
After relaxing Saturday, we had an invitation from one of our site coordinators Lugi Calori of Vergato near Bologna. The place with magnificent mountains and amazing climate, is the best place to live in summer. There was a summer fest which exemplify their traditions. We had the delightful and mouth-watering food with orchestral music and as usual local Italian wine. It was a wonderful time in Vergato, thanks to Lugi Calori.
